Much attention seems to be being paid to the outlook for the rate market and the US Federal Reserve’s game plan when it comes to bond purchases. The outlook for corporate bonds seems equally important. A glimpse through the lens of the credit cycle analysis may provide more insights.
Corporate bonds seem to be one of the last resorts for yield in the bond market. US investment grade bonds have returned over 2.5% in the last twelve months, while US 10-year rates surged from 0.65% to 1.35%. The positive performance may be achieved through the excess return of over 5.3%.
As the name suggests, it is the return more (or less) than that of equivalent government bonds within a given period. This consists of the carry (corporate bond yield premium or spread) and the return resulting from spread compression. Indeed, euro corporate bond investors have been able to lock in a small positive return in the last twelve months despite negative yields, helped by an excess return of almost 3%.
Spreads and the credit cycle
Yield spreads have compressed substantially since the peak of the crisis on the back of early extraordinary monetary support and government guaranty schemes. But are corporate bonds still worth taking the extra risk at current tighter levels? In order to examine the future direction for spreads and corporate bond returns, the following section looks underneath the headline spread levels along with some input factors applied when analysing the credit cycle.
Since spreads of US investment grade and US high yield reached lows in June this year, at 80 basis points (bp) and 270bp respectively, the tightening trend appears to have ended. A deeper look into the European corporate bond market reveals that while the tightening was mostly supported by sectors less exposed to COVID-19 at first, high beta and COVID-19-punished sectors like airlines, autos, energy, lodging and aerospace produced the largest excess return in the last 12 months.
The same can be witnessed through the lens of rating buckets. In the US, high yield CCC-rated bonds have returned roughly 18% in the last year, almost double the performance of BB-rated bonds. Investors seem to be putting less focus on selection amid the hunt for yield, a typical phenomenon during mid-cycle phases.
Relative attractiveness supports spreads
Past cycles have shown high yield bond spreads, for example, tightening even when the outperformance of riskiest bonds (CCC) starts to reverse. And this time, the continuation of the “grinding tighter period” is mainly led by flows from dedicated bond investors that compare spreads to the next best alternative, being benchmark yields.
Spreads in relation to the very low yield levels suddenly appear more attractive again, as seen in many past crises. This time, US high yield spreads are three-times as high (270bp) as the 5-year US yield (90bp). In 2018 that ratio was one while in 2007 high yield spreads were only half that seen for US 5-year sovereign bond yields. This relative attractiveness of the spreads seems like an important factor keeping them at a relatively tight level during this period.
Spread and yield comparison, as described above, only consider one side of corporate bond markets. In a typical credit cycle analysis, various factors are considered. The following section highlights a few, potentially important, factors in assessing where we are in the credit cycle.
Anatomy of a credit cycle
A credit cycle describes the level of access to credit or funding for households and companies which varies over time and consists of four phases: expansion, downturn, repair and recovery. During the expansion phase there is easy access to funds and companies and households have cash to invest or spend. Asset prices generally surge until reaching peak levels.
With elevated leverage and credit in the system, credit costs can become too high and the asset base is not sufficient to serve these credit costs anymore. This may lead to the often quoted “Minsky moment” named after the US economist Hyman Minsky (the Lehman banking crisis in 2008 and the current property crisis in China are good examples of such moments). Thereafter, balance sheets are restored and leverage is reduced leading to a recovery.
Is the credit cycle different this time?
It can be argued that the peak of this crisis has passed and that the cycle may transition from the repair to the recovery phase. However, the pandemic-related crisis was triggered by an external factor and may not represent a typical cycle as described above. In any case, examining the contributing factors to the credit cycle may point to what might lie ahead for spreads and corporate bonds.
Credit cycle factors can typically be categorised into three segments: economy, asset quality and liquidity. Factors include default rates, level of bond issuance and use of proceeds, lending surveys, money supply and balance sheet quality.
Liquidity seems the main driver for spreads, though don’t forget about the economy
Liquidity can be measured in various ways. For now, it is grabbing much attention among investors. Central banks responded very quickly to the pandemic by providing extraordinary levels of liquidity through balance sheet expansion and increased money supply.
At almost $8 trillion, the US Federal Reserve’s (Fed) balance sheet grew by the highest level ever while growth in money supply ballooned to record levels. The expansion of the Fed’s balance sheet led to a prolonged period of spread tightening in the years after 2009 and following 2016 for example. At the same time, a reduction of the balance sheet in 2013 and 2018 led to greater volatility in spreads.
The anticipated tapering of asset purchases by the Fed would potentially withdraw an important support for spreads.
Encouraging recovery signs
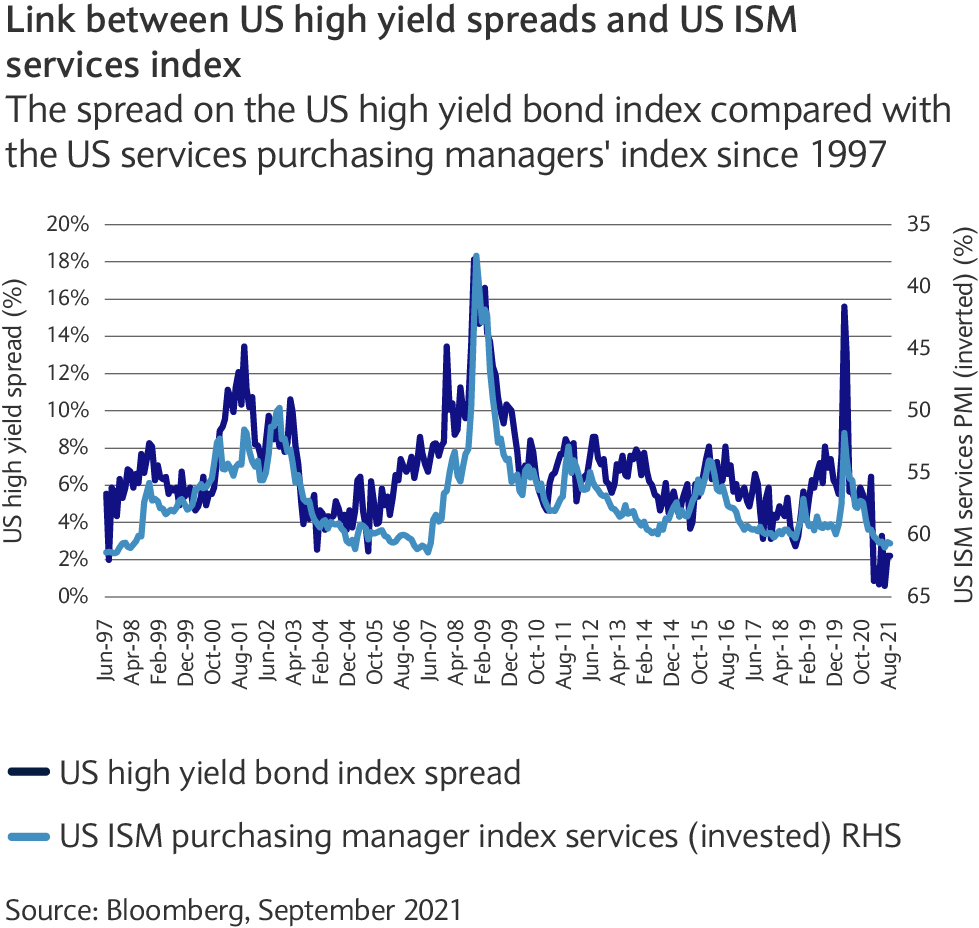
Another factor is the state and prospects for the economy. The global economy continues to recover from the crisis. High yield spreads in particular tightened in response to increasing purchasing manager confidence levels.
Levels over 60 measured by the US ISM service survey have corresponded with spreads trading close to record tights in the past. For instance, in 2003 the US ISM services oscillated at levels around 60 for almost 2.5 years keeping spreads at tight levels. In 2014 this period of high ISM readings and tight spreads lasted one year and in 2017 2.5 years (see chart).
Only in a period when both ISM surveys and monetary support declined have spreads started to widen substantially. The ISM survey has been over 60 for only the last six months, potentially leaving room for a period of tighter spreads.
Debt: the new medication
The third input factor which seems key is the level of leverage. This section focuses on leverage in the corporate sector in particular. The amount of debt outstanding among US investment grade issuers has doubled over the last decade to over $7 trillion. At the same time the leverage ratio, which compares debt to operating profit, surged from 1.7-times earnings to around 2.7-times earnings. A quarter of the issuers have leverage of more than four-times their respective earnings.
Meanwhile, leverage among high yield issuers declined in the US to 4-times earnings, below the 2008/2019 levels. The decline in leverage within the high yield market in recent months is partly a result of highly leveraged issuers dropping out of the universe as they defaulted during the crisis. Indeed, some larger former investment grade issuers have joined the high yield segment after being downgraded to high yield status (known as fallen angels).
Despite the earnings recovery of late, leverage remains comparatively high. The classical repair phase of the credit cycle, in which leverage after a crisis is reduced substantially, does not seem to have kicked in this time: taking on more cheap debt seems to have been the way out of the crisis for many.
Debt is affordable
It seems to have been affordable and efficient for many corporate issuers to operate on higher debt levels. The average coupon for US high yield issuers, for example, is 5.8%. Investment grade companies can be quick to point to the improved interest cover as earnings are roughly ten times as big as the interest cost. However, a brief look over the longer term reveals that this supposedly high interest cover has deteriorated over the last five years. The question remains how much debt is still affordable?
Positive backdrop supports spreads
For now, the outlook for corporate bonds has improved significantly since the peak of the crisis eighteen months ago, and spreads should still enjoy support from improving economic backdrop and monetary support. Default rates are declining at a fast pace with the trailing 12 months’ rate for global speculative issuers 3.3%, from a peak of 6.8%, and is expected to decline further this year according to rating agency Moody’s. At the same time, rating upgrades appear to dominate again.
Don’t splash the cash
Corporate behaviour is likely to become key. Should companies start to exploit low interest levels by taking on more debt to fund M&A deals and commencing large-scale shareholder distribution via share buybacks or dividends, then the next cycle may start without having gone through the repair phase in this one.
Should companies start to exploit low interest levels by taking on more debt to fund M&A deals...then the next cycle may start without having gone through the repair phase in this one
Tight spreads in combination with an overall higher level of leverage warrant a disciplined approach as there is higher risk for volatility. It may involve avoiding the highest beta bonds offering the highest spread. Investment grade bonds, especially with higher duration, look expensive in this context while lower quality high yield bonds seem the most exposed to corrections.