Different inflation dynamics
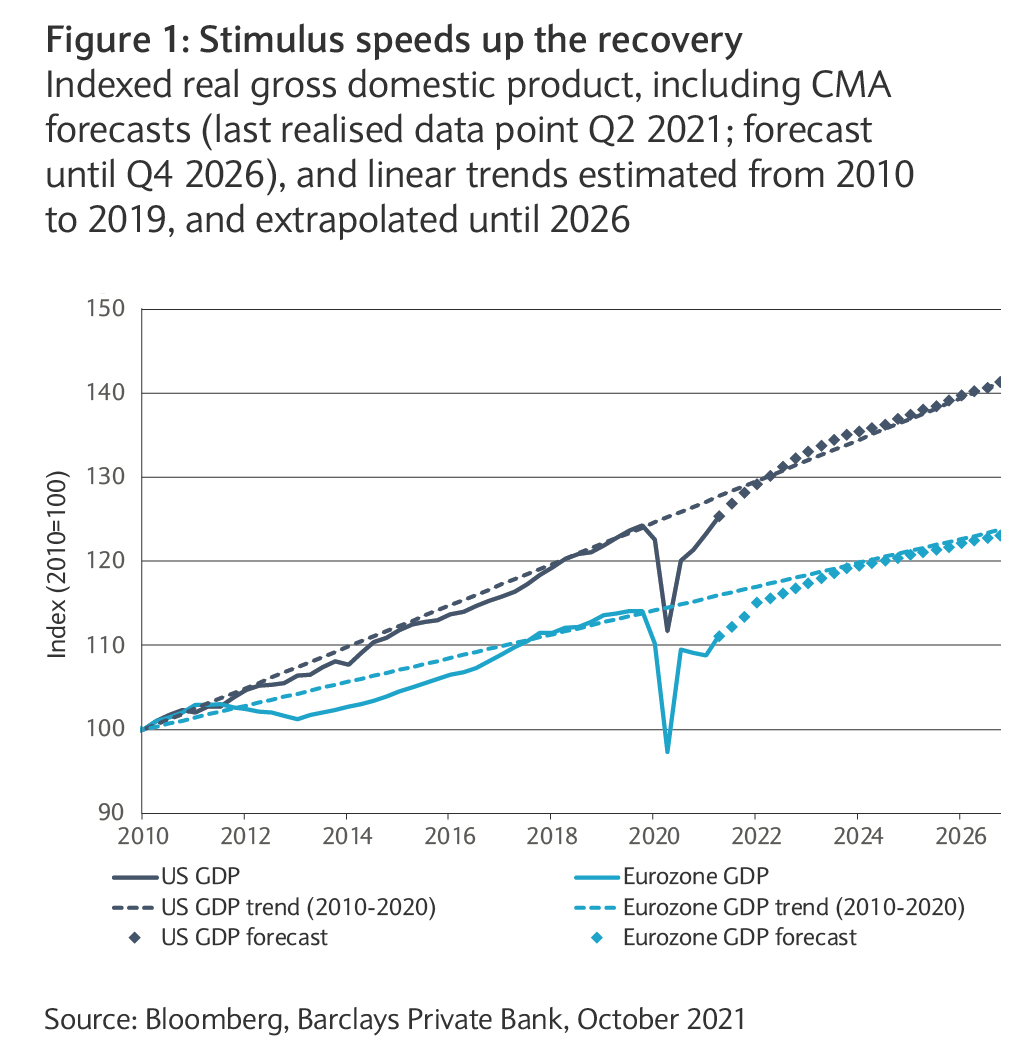
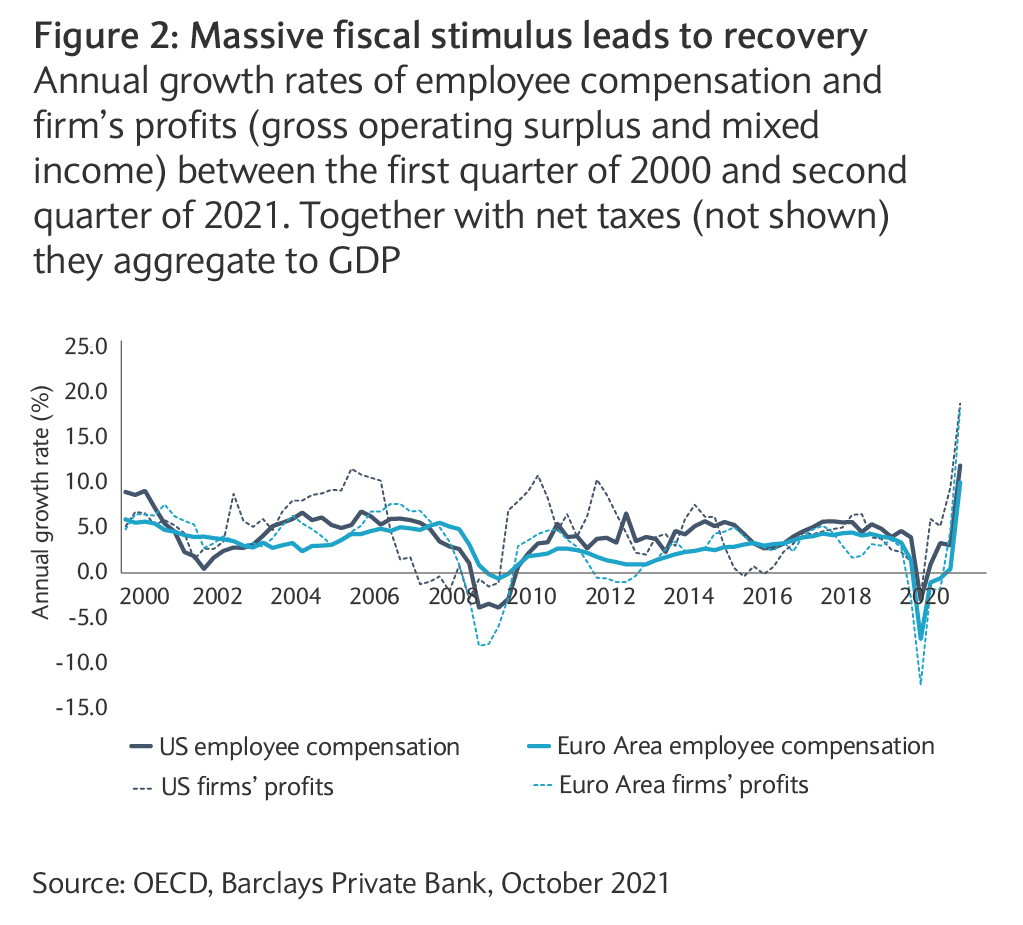
This fiscal-fast forwarding, and the difference in stimulus application, have strong implications for our inflation outlook. For the US and the UK, we expect central banks to overshoot the inflation target range in the later years of our forecast horizon. Eurozone and Swiss inflation rates, on the other hand, are expected to remain within their respective target range, thus reflecting the reduced risk of overheating in the medium term.
The ongoing push towards greener economies may well drive up inflation rates in the short-to-medium term, driven by a rush to secure access to natural resources, such as aluminium and copper. In the long term, however, we expect the effect of green transition on inflation to be more muted.
Return of the Taylor rule
The speed at which the central banks increase their policy rates, in our projections, is a function of the speed at which economies catch up to the pre-pandemic trend, and the inflation rates they are expected to encounter along the way. In other words, we expect “Taylor rules” to drive our assessment of monetary policy again, and, now more than ever, since the global financial crisis.
Macroeconomic methodology
Our modelling methodology for the macroeconomic determinants revolves around long-term anchors such as historic averages and central bank target ranges as well as the blending of different views with regards to the dynamics towards those long-term anchors. By restricting our look-back period for long-term averages to the year 2000, we acknowledge that structural breaks have made economies from today difficult to compare with their pre-globalisation counterparts.
By relying on Bloomberg economic consensus data, which aggregates information from almost 70 global banks and blending it with our own expert views, we rely on an extensive body of academic research suggesting that survey-based methods and forecast pooling are a robust and powerful method. See our upcoming methodology whitepaper for more details.
Building expected return blocks
Our methodology for estimating expected returns is based on a simple, yet powerful, framework that breaks down expected returns into three complementary building blocks: income, growth and valuation. The returns of listed assets can all be attributed to these three blocks. For non-listed assets, this is complemented with a fourth block capturing illiquidity premia.
Along with expected return projections, we forecast expected volatilities and correlations. To this end, we have developed a methodology that takes into account the varying behaviour of asset class returns across risk regimes.
Fixed income: nominal assets when inflation is rising
Speaking about building blocks, fixed income returns are primarily a matter of fixed “income” or the expected level of bond yields. Valuation adjustments have considerable effect on returns for shorter investment horizons, as they reflect changes in prices directly. Over a longer horizon, however, moves in yields and prices will offset each other, to some degree. The growth component is estimated from the spot yield curve, and reflects the return of rolling down the yield curve.
Our expectation for relatively elevated inflation rates, and the start of a hiking cycle, make investing in fixed income a challenging exercise, demanding increasing selectivity.
High yield and emerging market bonds can support returns in debt, but their relative attractiveness has decreased compared to previous years.
Government bonds reflect different stages of the hiking cycle
While we expect the US Federal Reserve and the Bank of England to conclude the rate-hiking cycle, for the policy rate, by 2026, the European Central Bank as well as the Swiss National Bank are far from the end of the cycle by the end of our CMA horizon. These discrepancies drive the differences in the outlook for the income component of our government bond total return projections.
Credit spreads to remain low
With increasing issuer risk, spreads over government bonds widen, and so does the income building block while the relative importance of growth and valuation dwindles.
Current spread levels are low by historical standards, driven by ample liquidity in the market. When, as we expect, this liquidity is gradually drained away, we believe the growth impulse will be enough to keep a lid on these spreads.
As such, our risk assessment of credit has not changed significantly, limiting the relative attractiveness of riskier fixed income assets compared to government bonds in a portfolio context.
Equities: up when inflation is elevated
Breaking down equity returns into building blocks is straightforward: the income component represents dividends and net buyback yields, growth reflects nominal earnings growth, and valuation the expected change in the cyclically-adjusted price-earnings ratio.
The growth component is modelled by a return to the long-term average earnings growth plus the inflation projection. Given our expectations for above-trend growth paired with a regime of moderately higher inflation, the growth component is the main driver of our equity return projections.
Equity income has come under pressure lately, but we expect it to slowly revert to its longer-term average, as the recovery evolves and companies face less uncertainty with regards to their cash flows. Valuations should turn into a moderate headwind, as we expect a gradual multiple contraction over the course of the CMA horizon.
Attractive longer-term outlook for UK equities
Among developed market equities, UK equities look particularly attractive. This is a function of some catch-up potential in earnings growth in a global recovery, elevated inflation rates and considerably less potential for valuation corrections. The risks for this outlook are predominantly of political nature. A deterioration of the trade relationship with the EU cannot be ruled out, although it is not our base case.
Real assets thrive with inflation
Like bonds and equities, returns of commodities can be broken down to income, growth and valuation blocks. Income represents the interest on the collateral, which is approximated by the return on a three-month US Treasury bill in our case, and is – compared to the others - negligible.
The growth component reflects the shape of the futures curve of the broad commodities aggregate. Growth currently weighs on our projection as the curve is in contango. The most influential component, by far is valuation, and reflects our expectation for future spot prices. Even though prices have increased considerably lately, we believe that commodity prices can go higher. One short-to-medium term driver may be the transition to greener economies, which has the potential to support demand for a number of commodities.
Real estate falls into two categories in our CMA: publicly-traded real estate investment trusts (REITs) and directly owned real estate. We model REITs just like we would publicly-traded equities. In this regard, REITs provide comparable exposure to our income and growth building blocks, but do not suffer as much from the expected compression in valuations, according to our forecast. Direct real estate is estimated, like its listed counterpart, but with an added premium for illiquidity/complexity.
US dollar weakness on the back of inflation differential
Our CMA spans assets from different currency areas. Therefore, we project the four major currencies in the CMA framework: US dollar, euro, sterling and Swiss franc. Our forecasts consist of a view on real exchange rates and expected inflation differentials. The inflation differentials tip the scales against the dollar, in our projections until 2026, leading to moderate weakening against all other CMA currencies.
Regime-driven estimates of long-term risk
To estimate long-term volatilities and correlations, we compute risk-on and risk-off covariance matrices. These regimes are typically characterised by relatively low and high volatility, respectively. Our long-term risk parameters are calculated by combining the regime-specific covariance matrices. The mixing weight determines whether the final matrix will be in line with neutral, historical estimates (equal weights) or biased towards the risk-on or risk-off regime (unequal weights).
In an investment environment characterised by low interest rates, inflation uncertainty, geopolitical risks, and relatively high valuations, we expect to see somewhat elevated volatility in financial markets going forward. Therefore, our long-term risk parameters are estimated by slightly overweighing risk-off regime in our covariance matrix calculations.
Diversification for the long run
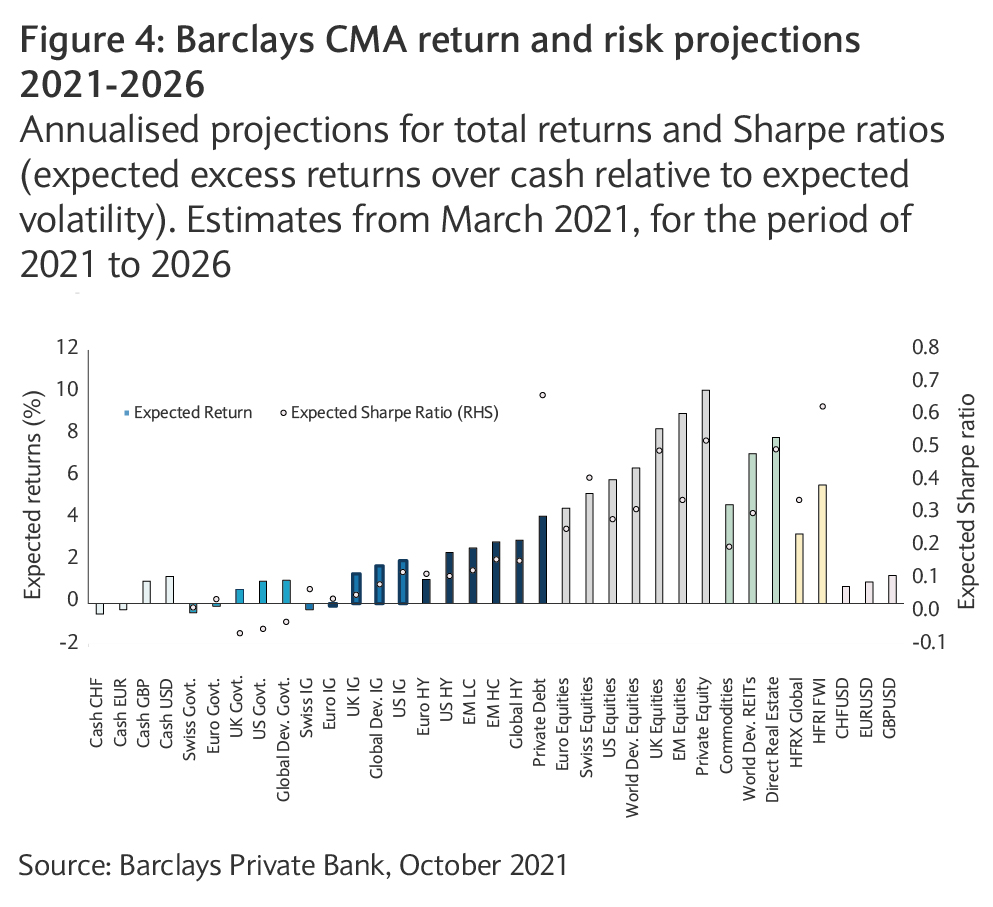
By putting together our expected long-term return and risk estimates, the key message is that our baseline scenario is anchored by growth expectations over the next five years, however the road ahead might be bumpy at times. Although equities are preferred to fixed income, the risks should not be neglected. In our view, it is necessary – perhaps more than ever – to build a portfolio that is well diversified across a spectrum of asset classes, including alternative investments such as commodities and private markets.


