It’s been a violent year for global equities, which returned to bear market territory in September. Views on the way forward are incredibly polarised. We step back from the current market volatility to reflect on equities’ long-term return potential, using history as a guide.
It would be an understatement to say that equity investors have had a wild ride this year. At the time of writing, the MSCI All Country World Index is down by 25% from its January peak (through its June lows), but not in a straight line. Its path has been rather erratic: a slide of 14%, followed by moves of +10%, -15%, +7%, -11%, +13%, and -14%.
Along the way, a lot of investors have been wrong footed, and views on where markets will go next have become incredibly polarised.
While the near-term environment remains murky, we reflect on global equities’ long-term return potential.
Equity markets remain challenged in the near term
Uncertainty is likely to prevail in the short term, with risks skewed to the downside. Inflation looks like moderating in the coming months, but could stay elevated for a while. The US Federal Reserve (Fed) has become increasingly hawkish in its fight against rising prices, and is now prepared to sacrifice growth and risk a recession.
After the September Fed meeting, chair Powell conceded that: “The chances of a soft landing are likely to diminish to the extent that policy needs to be more restrictive, or restrictive for longer. Nonetheless, we’re committed to getting inflation back down to 2%. We think a failure to restore price stability would mean far greater pain.”
Other central banks are communicating along the same lines. The message couldn’t be more explicit: financial conditions will be tighter for longer and recession probabilities have substantially increased. The big question now is around the timing, magnitude, and duration of the next recession.
Yield curve suggests a recession is likely
The 2s10s US yield curve, which initially inverted in March as 2-year bonds yielded more than the 10-year ones, broke below -50 basis points (bp) in late September, a level that has been reached, or even approached, only twice in the past 40 years: in April 2000 and March 1989. On those occasions, a recession followed in the next ten months in the case of the former, and 15 months for the latter.
Yield curve inversions have been reliable indicators of recessions, and a consensus of economists now puts the probability of a recession in the next 12 months at 50% in the US and 73% in the eurozone. Barclays’ economists now expect advanced economies’ gross domestic product to contract in 2023.
But what are the longer-term prospects for equities?
For investors who can ignore the current period of extreme uncertainty, and tolerate market volatility, what are the longer-term prospects?
While risk assets typically struggle in this type of environment, equity markets have already moved a long way and are pricing in some of those risks. The MSCI All Country World Index trades on a forward price-to-earnings (PE) multiple of 14.6 times (x), down from 18.4x in January, and is back in line with its 20-year average. The de-rating is due to the collapse in equity prices, as forward 12-month earnings estimates have barely moved over that period.
However, while valuations certainly appear more attractive now, we would refrain from making hasty investment decisions purely based on forward PEs at present.
As we have argued before, forward earnings PEs are distorted by unrealistic earnings assumptions. We expect earnings forecasts to be downgraded materially in the coming months, as it becomes apparent that companies cannot sustain margins in the face of slowing growth and stubbornly high inflation.
Bottom-up analysts still expect global earnings to grow by 11% this year, and by 6% next year. This is substantially higher than the 7% year-on-year earnings decline suggested by our top down earnings model by the first quarter of 2023.
Turning to cyclically adjusted price-to-earnings multiples
This is why we turn to nominal cyclically adjusted price-to-earnings multiples (CAPEs) to assess equities’ long-term return potential. We define CAPEs as the share price divided by nominal ten-year average earnings, as opposed to the price divided by expected earnings in the next 12 months.
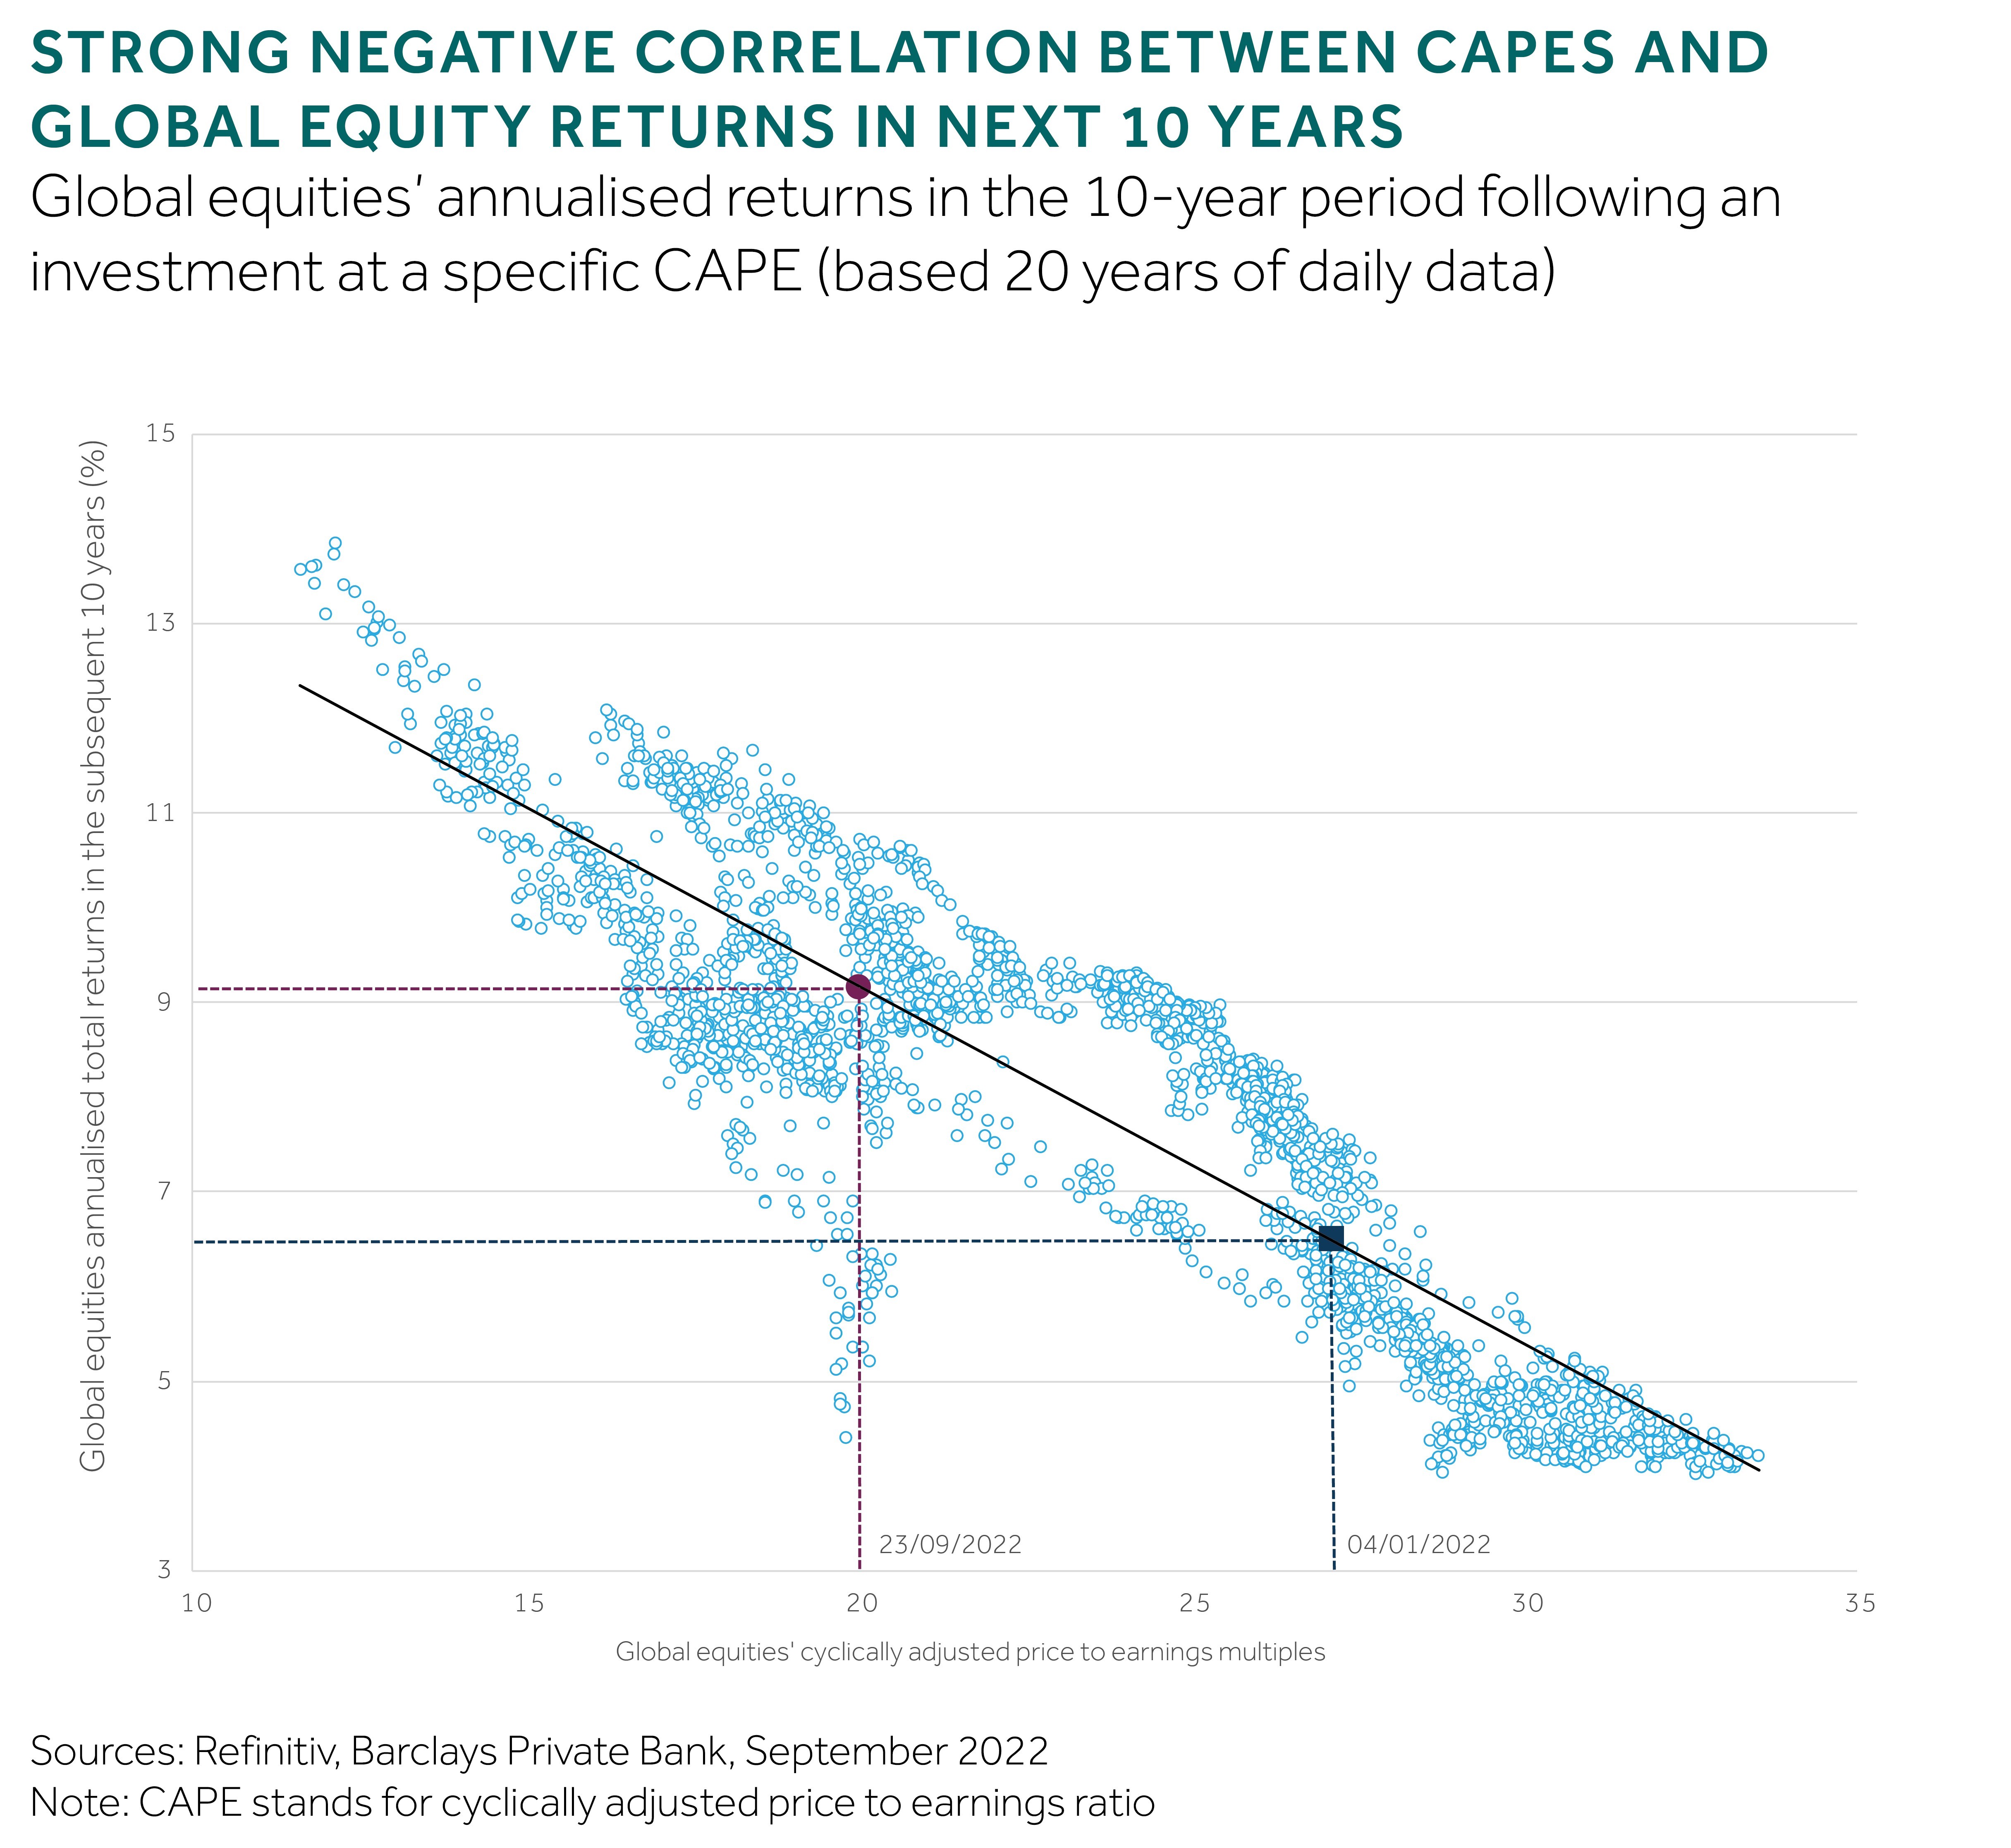
It is generally accepted and well documented that buying equities on a low CAPE leads to stronger investment returns in the subsequent years. While not new, the strength and consistency of this relationship can easily be forgotten. Indeed, in times of heightened uncertainty, it is helpful to take a step back from market volatility, and use history as a guide for future returns. Albeit, past performance does not guarantee future performance.
CAPEs are particularly useful when looking ten years’ out
For the purpose of this article, we explored the relationship between CAPEs and historical returns from stocks, in absolute terms and relative to bonds, in the years following an investment at a specific CAPE.
In doing so, we considered various sample periods (ranging between 20 and 40 years of history), and tested forward returns over the subsequent three, five, and ten years. This showed that CAPEs are most useful for predicting forward returns over the following ten years, using 20 years of history.
The other combinations also yielded strong correlation coefficients (notably when using forward five-year returns over a 20-year history), but the standard errors were larger. In terms of examining longer histories, we felt that the world was too different prior to 2002 to make useful comparisons.
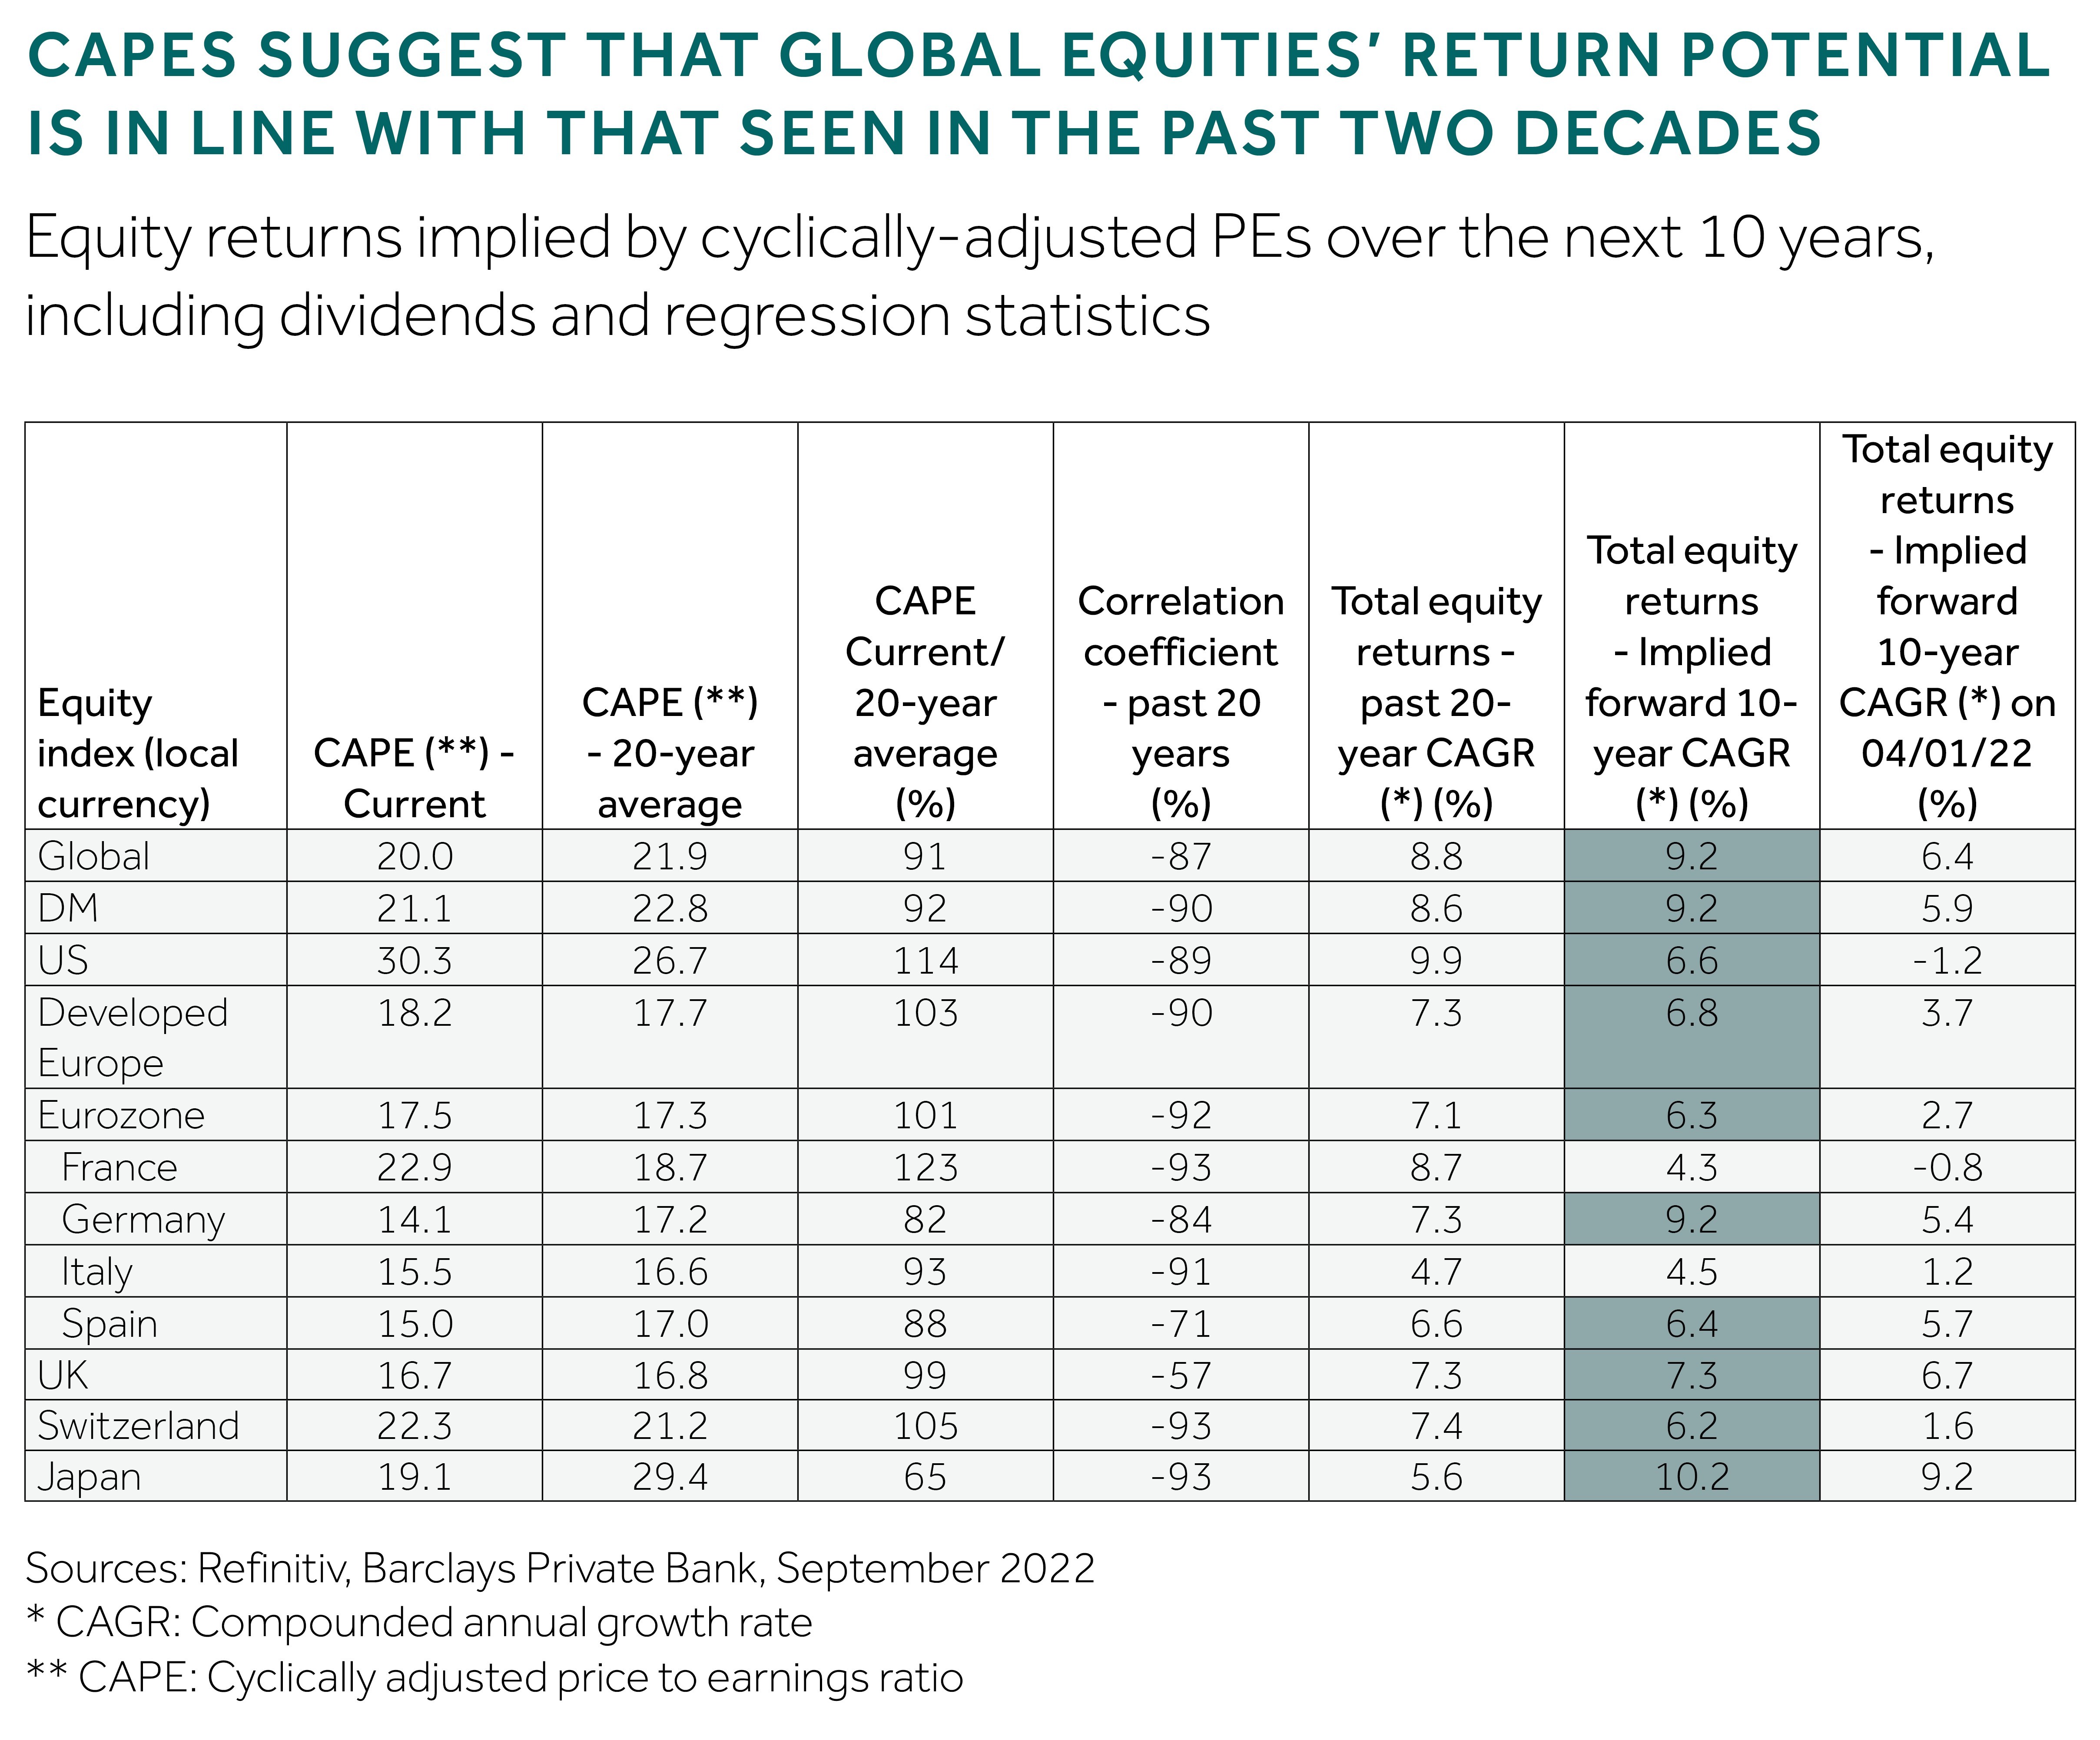
More specifically, we found a -89% correlation coefficient between CAPEs and forward ten-year returns, over the 2002-2022 period (see chart). This correlation coefficient weakened to -80% when looking at forward five-year returns.


