FX: why going against the herd pays off
Imagine measuring 30-minute interval price changes for a universe of currency crosses, and then comparing these price changes versus a ‘random walk’ - can we use this information?
High frequency data is more likely to be described by a ‘random walk’ than, for instance, monthly or quarterly data that may be more influenced by macro trends.
We look at whether we can detect any ‘tails’ in the high frequency data, in other words whether price changes have been abnormally lower or higher.
Our interpretation is that it infers something about investor positioning or sentiment. If the intraday price change is in excess of what can be explained by a ‘random walk’, it is indicative of where the clearing price sits at which supply and demand meet (i.e. the willingness of the other side to accept the trade).
How upside tails compare to downside tails in price changes is called ‘skewness’.
We look at the one-month realised intraday skewness across the full G10 universe and define a naïve trading strategy that each month picks a number of currencies that rank at the bottom in the universe, thus where prices have adjusted lower as investor have been ‘selling’ or reflecting a more pessimistic sentiment to clear at a market price.
And vice versa - the trading strategy selects a number of currency pairs that rank at the top in this universe.
Cumulative returns of a basic investment strategy
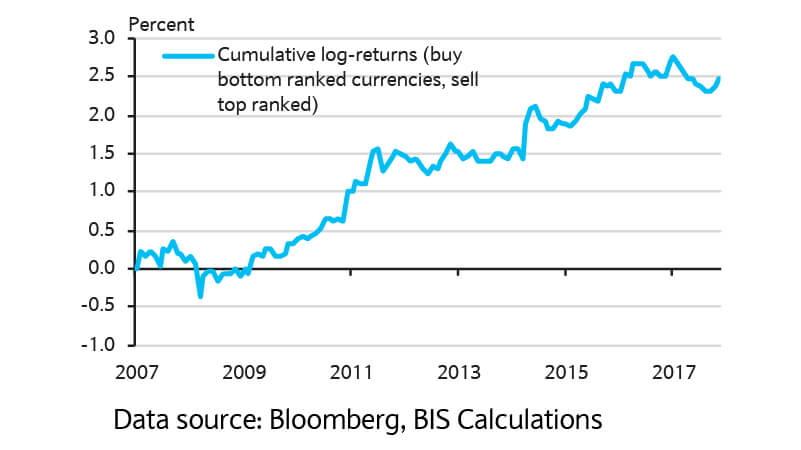
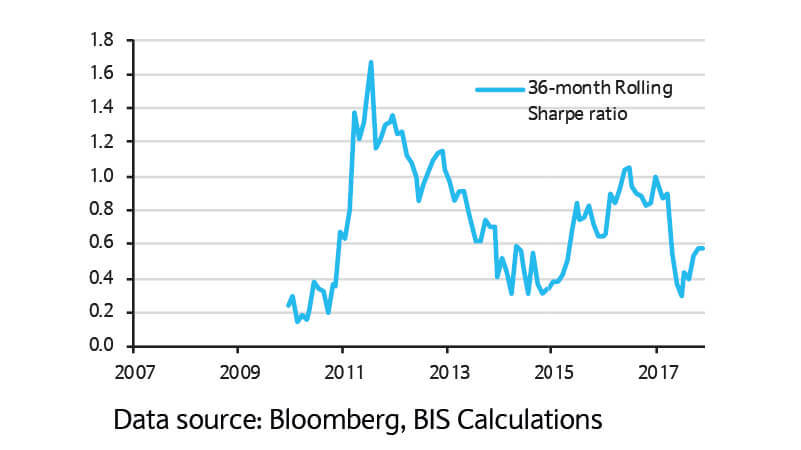
Consistently screening for high/low realised price-‘tails’ as a reflection of positioning or sentiment seems to pay off over time in our research (figure 1 and 2).
Rolling Sharpe ratio
Buy or sell?
Most recent information indicates a ‘buy’ signal for the Swedish krona and the New Zealand dollar largely versus a ‘sell’ signal for the Swiss franc.
The positioning we detect for the Swiss franc chimes with our observation that the Swiss franc has likely received favourable safe-haven flows during the Italian coalition headline news.
Of course investor behaviour such as positioning is not the sole driver to look at and acts as just one out of a range of indicators we track when assessing the prospects in exchange rates.
We look for indicators that have a solid intuition and are backed by historical evidence. Additional lenses through which we view currencies are for instance valuations, carry and mean-reversion. These factors will help us in providing a sensible starting point that feeds into the tactical asset allocation process.