Equities – a valuations snapshot
Stock market valuations are a contentious topic – there are a multitude of metrics to measure “value”, each with their own pros and cons.
To complicate matters further, changing accounting standards often lead to measurement errors in computing valuation these metrics.
Therefore, we think it’s best to assess stock market valuations through the lens of a range of various metrics.
Given this year’s price gyrations in the equity markets, we take stock of how valuations have changed over the course of 2018.
Finding the losers
We start off by looking at the trailing price-to-earnings (PE) ratio, as it is the most intuitive and commonly used valuation measure.
Overall, we’ve seen trailing PE ratios fall across the major equity markets as earnings trended upwards amidst sharp falls in share prices.
Looking at the numbers, the markets that had the steepest de-ratings are the MSCI UK and MSCI Europe ex-UK, where trailing PEs have fallen by 30% and 25% respectively.
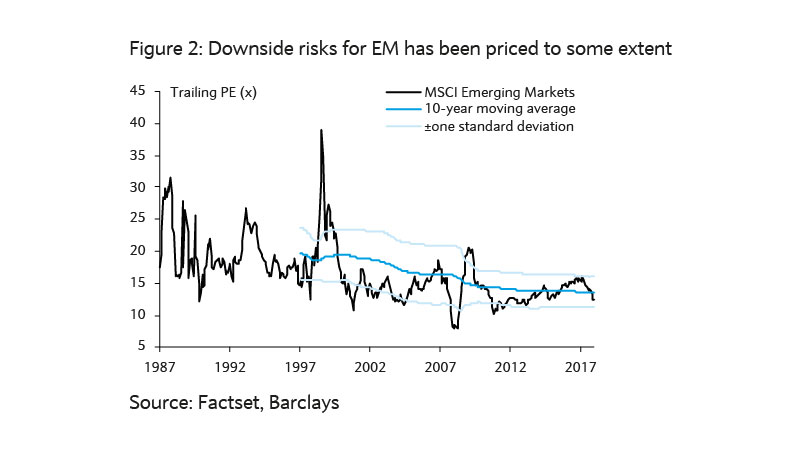
Meanwhile, MSCI Developed Asia and MSCI Emerging Markets (EM) look to be the cheapest in absolute terms relative to their past, with current PE ratios a fair bit below their long-run averages.
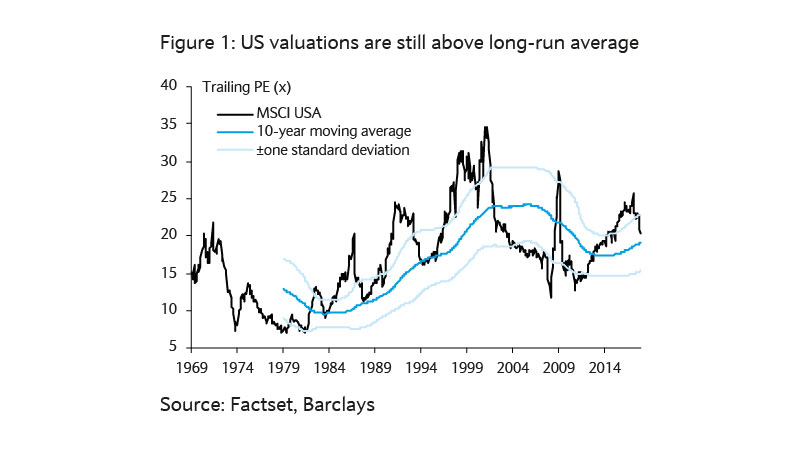
It’s also noteworthy that despite a sizeable valuation de-rating of about 20%, the trailing PE ratio for the US equity market is still above that of its long-run average (figure 1).

Nonetheless, we see no region exhibiting a trailing PE that is extreme relative to history at the moment.
However, one problem with trailing PEs is that they only reflect earnings from the past year, which may be misleading if earnings have experienced a temporary slump.
For example, trailing PE ratios for the UK stock market were biased upwards in 2017 due to the market’s outsized exposure to the commodity slump of 2015-2016.
We’ve also seen the valuation measure yielding nonsensical values for the Japanese equity market in the past, when aggregate earnings were in negative territory.
To augment this analysis, one can look at forward PE ratios, which uses consensus forecast earnings instead. Doing so leads to more stable values for the UK and Japanese markets. However, one obvious drawback is that no one knows how much earnings will grow next year.
Analysts try to estimate this but frequently get it wrong, largely overestimating and making stock markets appear cheaper than they really are.
Looking at forward PEs, we observe a very similar pattern, with the US looking to be the most richly valued, while EM and Developed Asia have undershot their long-run averages.
Price-to-book measures yield similar findings. There are other alternative valuation measures out there, but that’s beyond the scope of this article.
Valuations and tactical asset allocation
We’ve written extensively about valuations in the past, where we’ve highlighted that tactical asset allocation based on valuations tend to fare badly.
Our past research has found that while valuations exhibit some return predictability over longer time horizons, they have little predictability over a tactical time horizon.
Here, we use valuations to give us a picture of how expectations are priced in for each of the regional markets.
Rather than allocating systematically based on valuations, we use valuations as one of many indicators to augment our discretionary tactical bets.

Taking a holistic view of the various valuation metrics, the data doesn't show any valuation extremes for the regions, and it lends evidence to our view that downside risks for EM have been priced to some extent already (figure 2), while a lot of good news has already been priced into the US.