
Market Perspectives June 2021
Investor sentiment has subsided as inflationary pressures build. Our investment experts highlight our main investment themes, examining if consumers can drive the recovery.

04 June 2021
By Jai Lakhani, CFA, Investment Strategist, London, UK and Nikola Vasiljevic, Head of Quantitative Strategy, Zurich, Switzerland
You’ll find a short briefing below. To read the full article, please select the ‘full article’ tab.
As we enter the post-pandemic era for investors, the traditional portfolio of equities and bonds could face some key challenges. For those focused on obtaining longer term returns, could private markets provide a solution?
Continuing to invest in a traditional 60% equities and 40% bonds split may face significant challenges over the next five years. The reasons for this appear to be a combination of strong expectations around the economic recovery, record fiscal stimulus, amid bloated government debt levels, historically low interest rates and the risk of higher inflation.
Historically low yields and rising inflation weigh on expected returns for developed market bonds via two channels – weak income return prospects and limited capital appreciation potential. While accommodative monetary policy should continue to support equity returns, returns will likely face pressure due to uncertainty, peaking economic momentum and expensive valuations.
Thus, the next five-year investment horizon will likely entail lower returns on main asset classes than history suggest.
Stabilising portfolios and fighting inflation
May’s Market Perspectives showed that during periods of higher inflation, the correlation between equities and fixed income becomes positive which means from a diversification standpoint, the traditional portfolio could fall short.
Building a well-diversified portfolio can substantially reduce risks and enhance risk-adjusted returns. Therefore, it could be time for investors to rethink their optimal asset allocation policies to address the issue of lower returns and higher uncertainty. The most efficient and flexible way to improve on traditional 60/40 portfolios is to consider inclusion of other asset classes.
In April’s Market Perspectives, we showed how the adding of hedge funds to a portfolio could not only protect portfolios during down markets but could add to performance during up markets.
In the May edition, we noted how the inclusion of real assets such as commodities, real estate and infrastructure can provide an inherent hedge against inflation, while also enhancing risk-adjusted performance during inflationary periods.
Reaching the ultimate frontier with private markets
However, for investors who are able and willing to tolerate some illiquidity in their portfolios, private markets can boost returns and improve diversification.
From December 2007 until September 2020, private equity (PE) posted average return of 10.7% per annum (see table). This was the highest return of all considered asset classes. It was ranked among the three best performing asset classes in 10 out of 13 years in the sample. A negative return was recorded only in 2008. In other years, the return on PE varied between 8.0% and 19.6%.
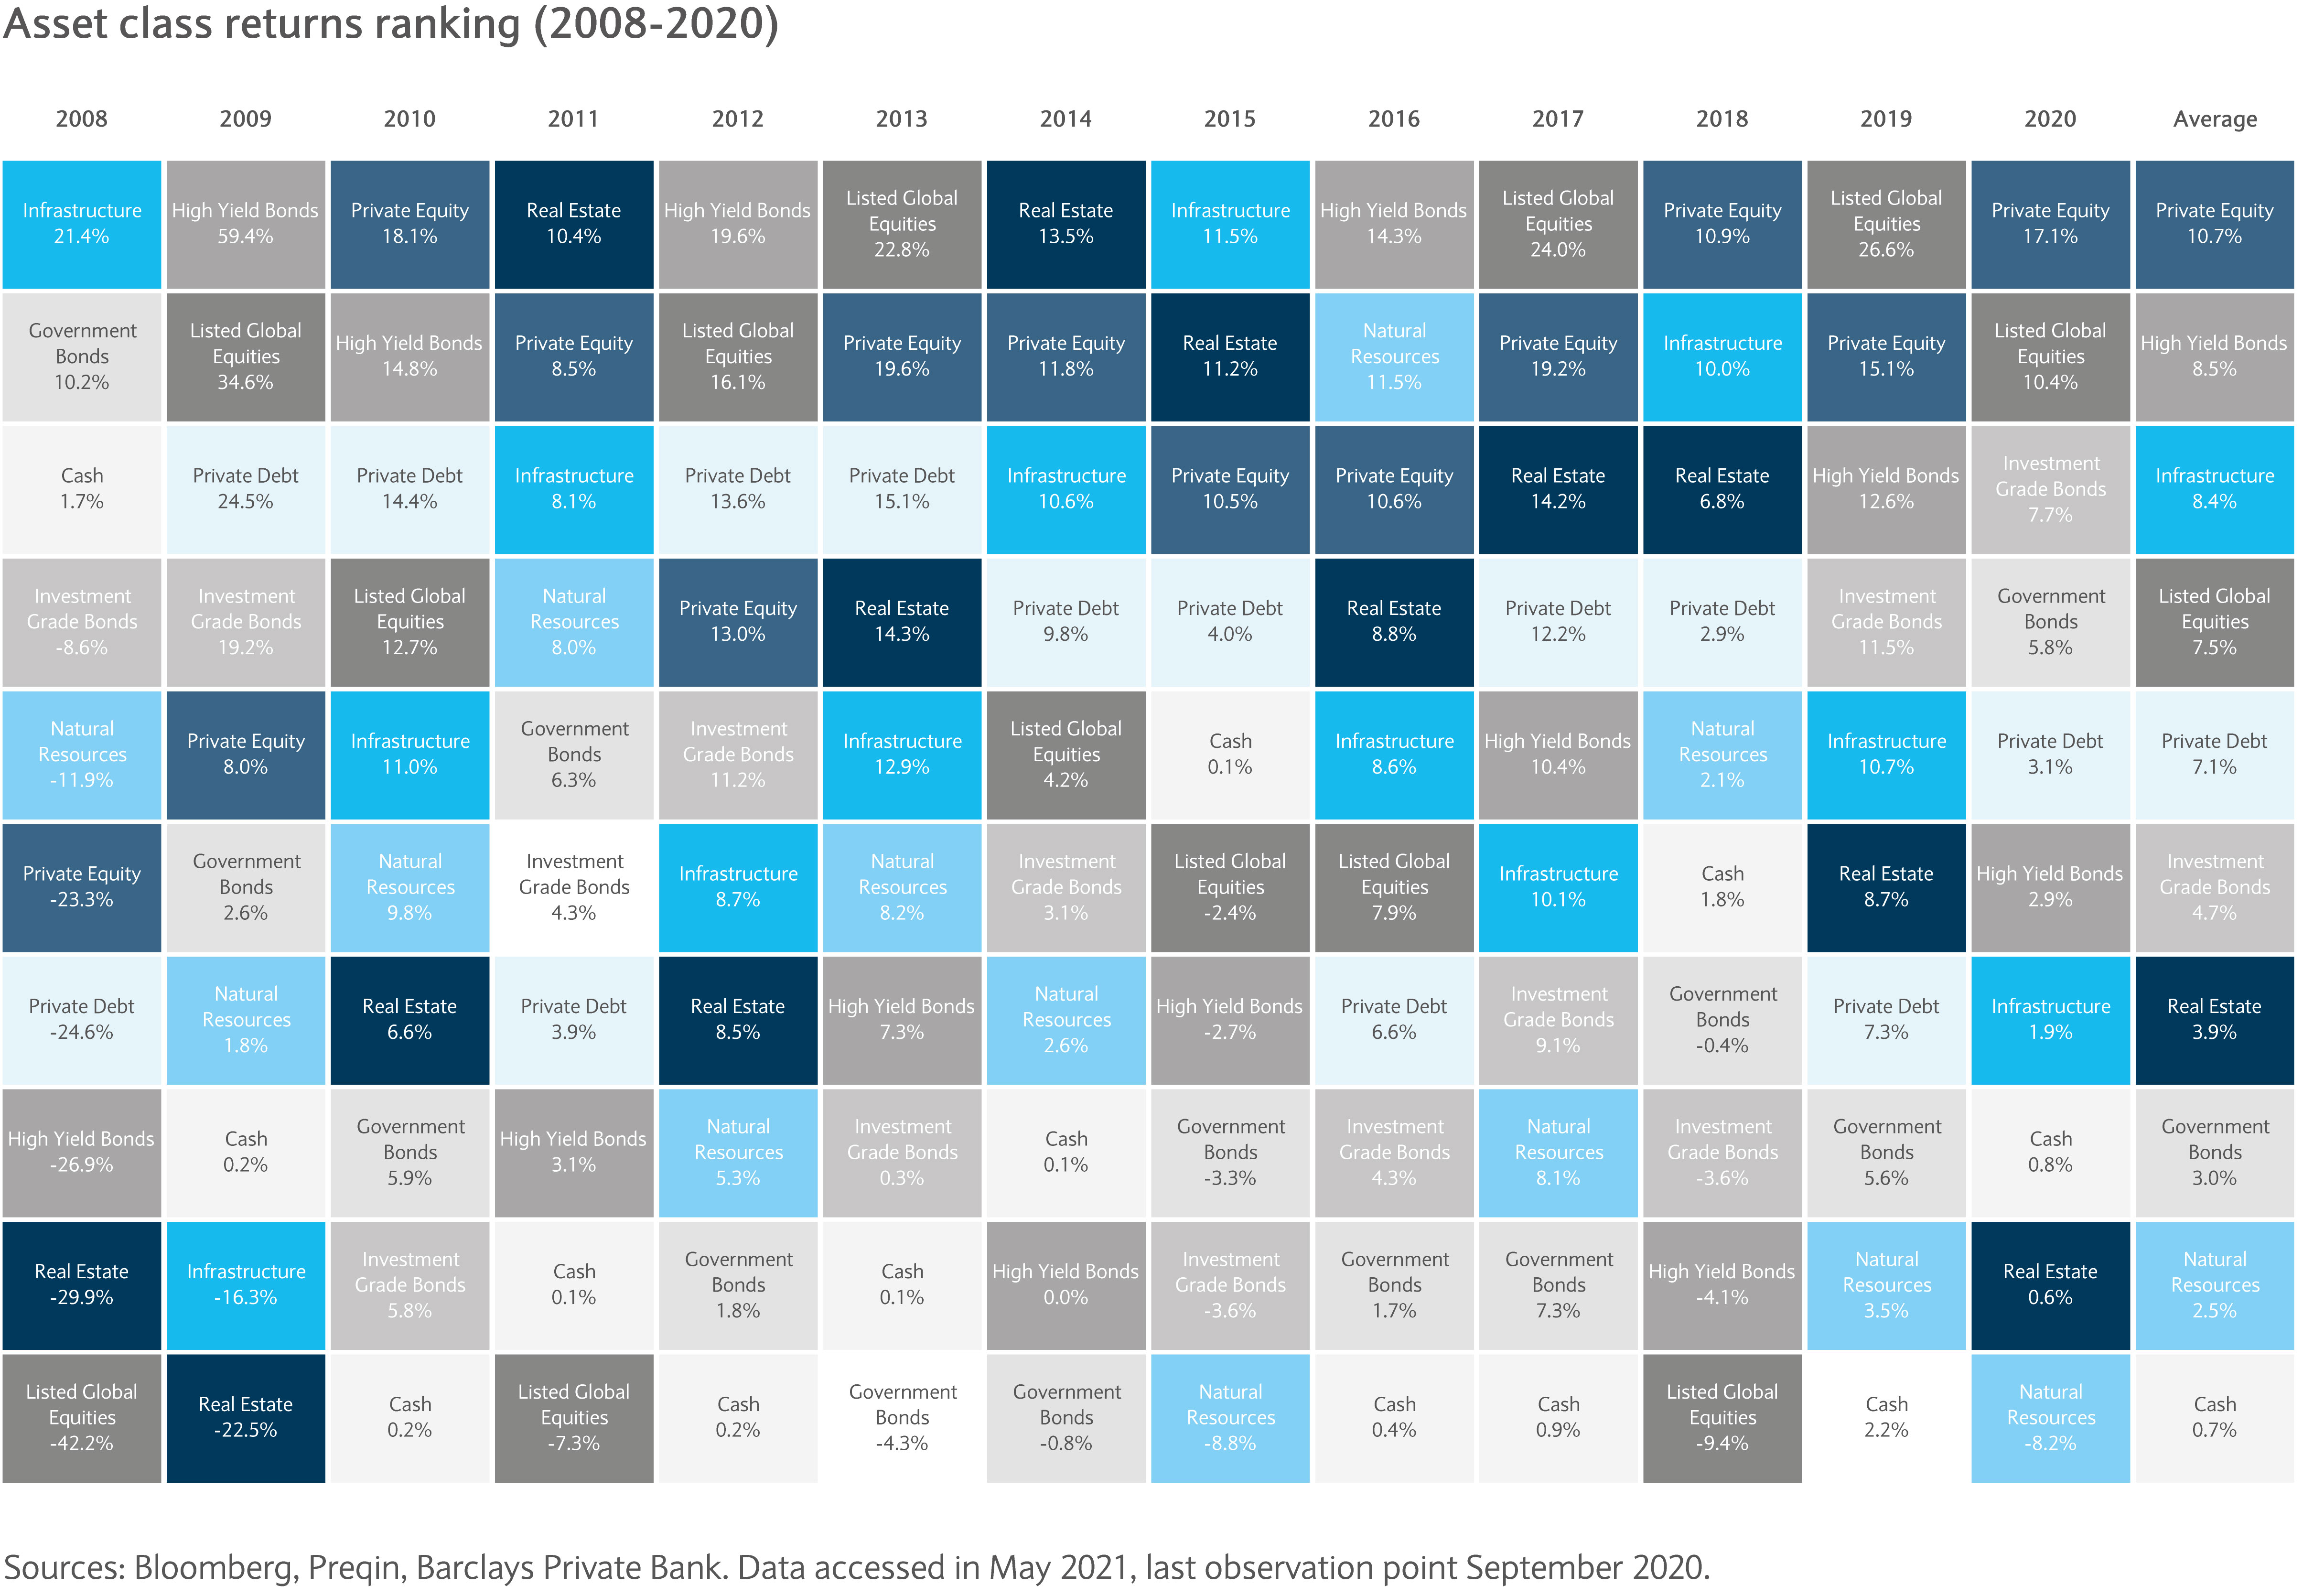
Other private markets also performed well. For example, private debt and infrastructure were in the negative territory only in 2008 and 2009, respectively. As a comparison, listed global equities posted negative returns four times (2008, 2011, 2015 and 2018). The average performance of private debt and infrastructure was similar to that of high yield bonds and listed global equities.
Taking a closer look at 2018, the year when apparently “cash was the king”, some liquid markets did lose money. However, all private markets actually displayed positive excess returns.
Differentiating between risk regimes
An average performance provides valuable information and paints the big picture. However, the resolution may not be sharp enough to differentiate between risk regimes.
When deciding on their strategic asset allocation mix, investors are likely to be particularly interested in asset classes which provide protection in down markets and offer attractive returns in up ones.
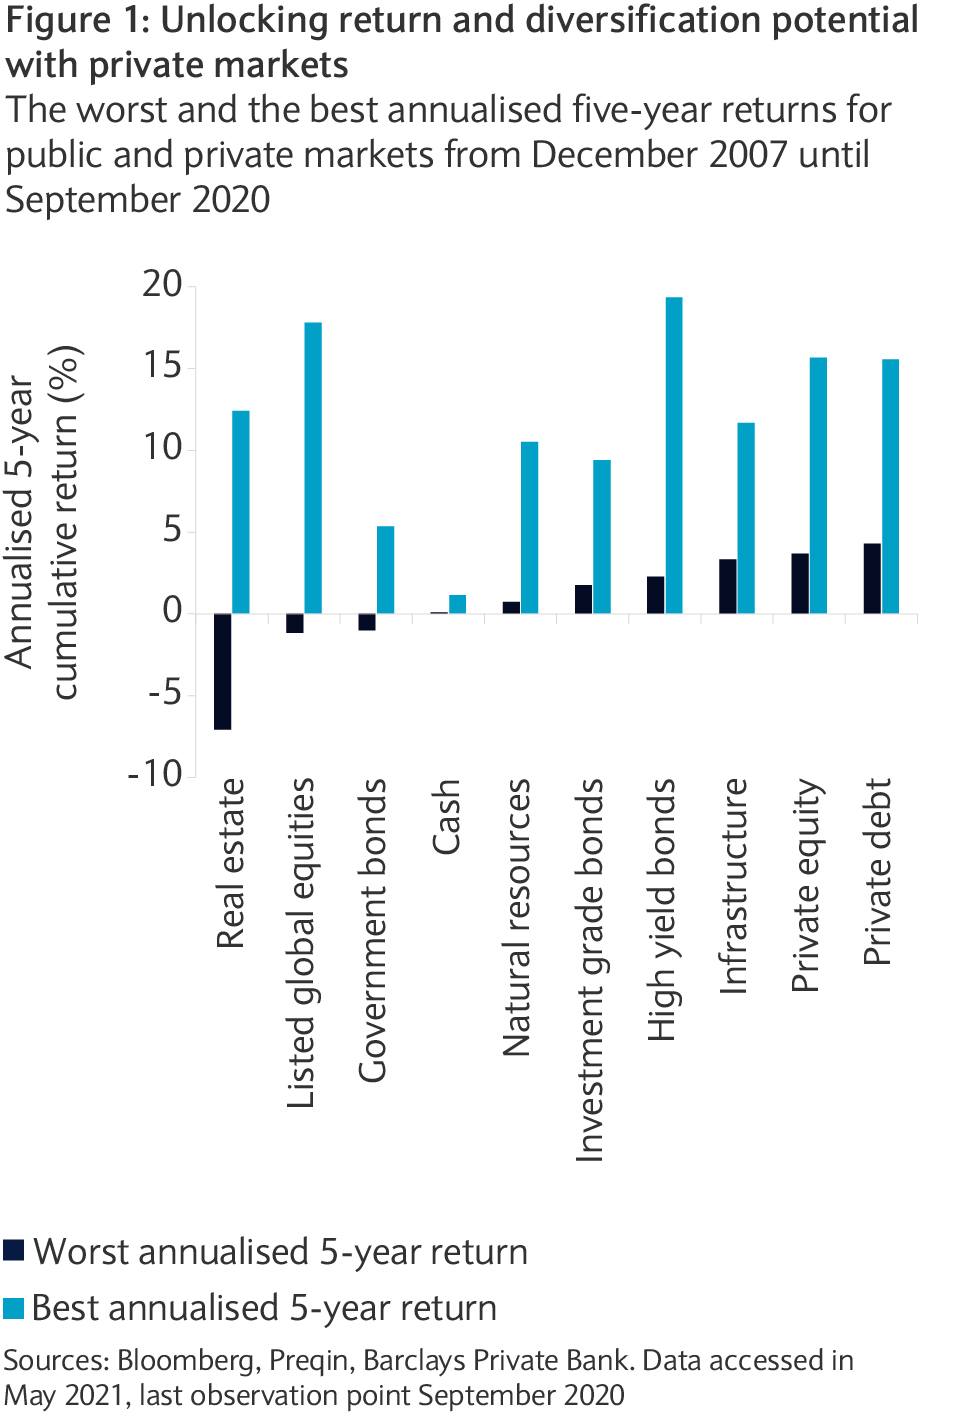
Figure 1 demonstrates that – since December 2007 – private equity, private debt and infrastructure performed positively over an investment horizon of five years. In fact, their worst five-year stretch (3.3-4.3%) compares favourably with public and other private markets. Historically, high yield bonds and listed global equities hold the pole position in terms of the best consecutive five-year performance (17.8- 19.4%), closely followed by private equity and private debt (around 15.7%).
Breaking down private markets investing
Private market investment represents ownership in privately held companies. Investors can tap into PE market through direct investments or indirectly via funds. The latter require commitments over a longer period of time – for instance, ten years – over which investors deploy capital and receive income and capital distributions.
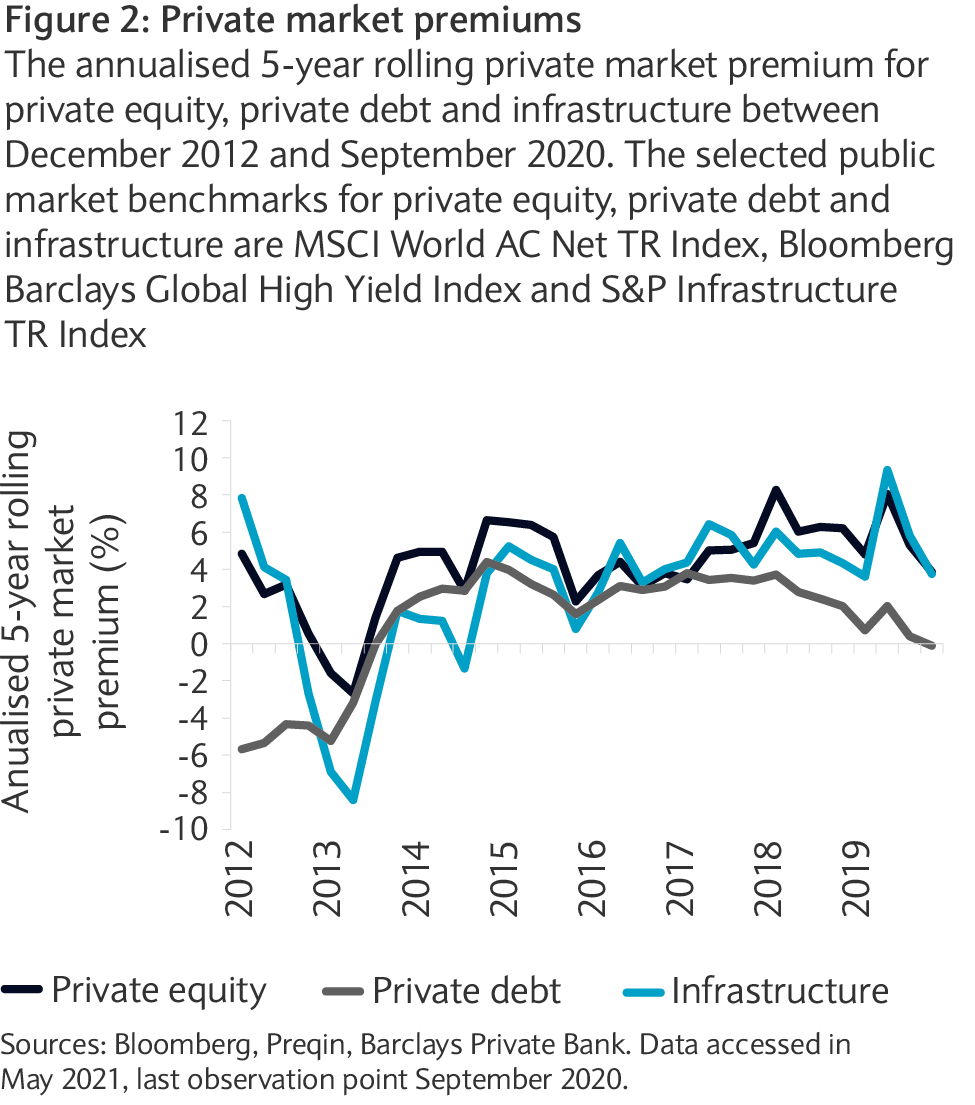
Liquidity is the fundamental difference between public and private markets. Investing in private markets means investors face systematic illiquidity due to long capital lock-up periods. Historically, the liquidity premium is about 2% on average. Over longer periods of time, the compounding effect boosts the wealth accumulation process.
Figure 2 shows the dynamics of the private market premium. Since December 2007, private equity, private debt and infrastructure added on average 4.3%, 1.2%, and 3.0%, respectively, on top of the selected public market benchmarks.
Growing asset class
During the past two decades, the growth in private markets has unsurprisingly been quite remarkable.
PE has earned the status of a stand-alone asset class. Active ownership, specific value creation and exposure to different businesses and factors relative to comparable public markets contribute to a unique investment profile and significant diversification benefits.
Despite a volatile fundraising year in 2020, as a result of the pandemic, assets under management (AUM) in private markets grew by 13.2% to a record $8tn (see figure 3), a compound annual growth rate (CAGR) of 12.4% since 2000. PE has been the key driver, growing at a CAGR of 10.9% over the same period.
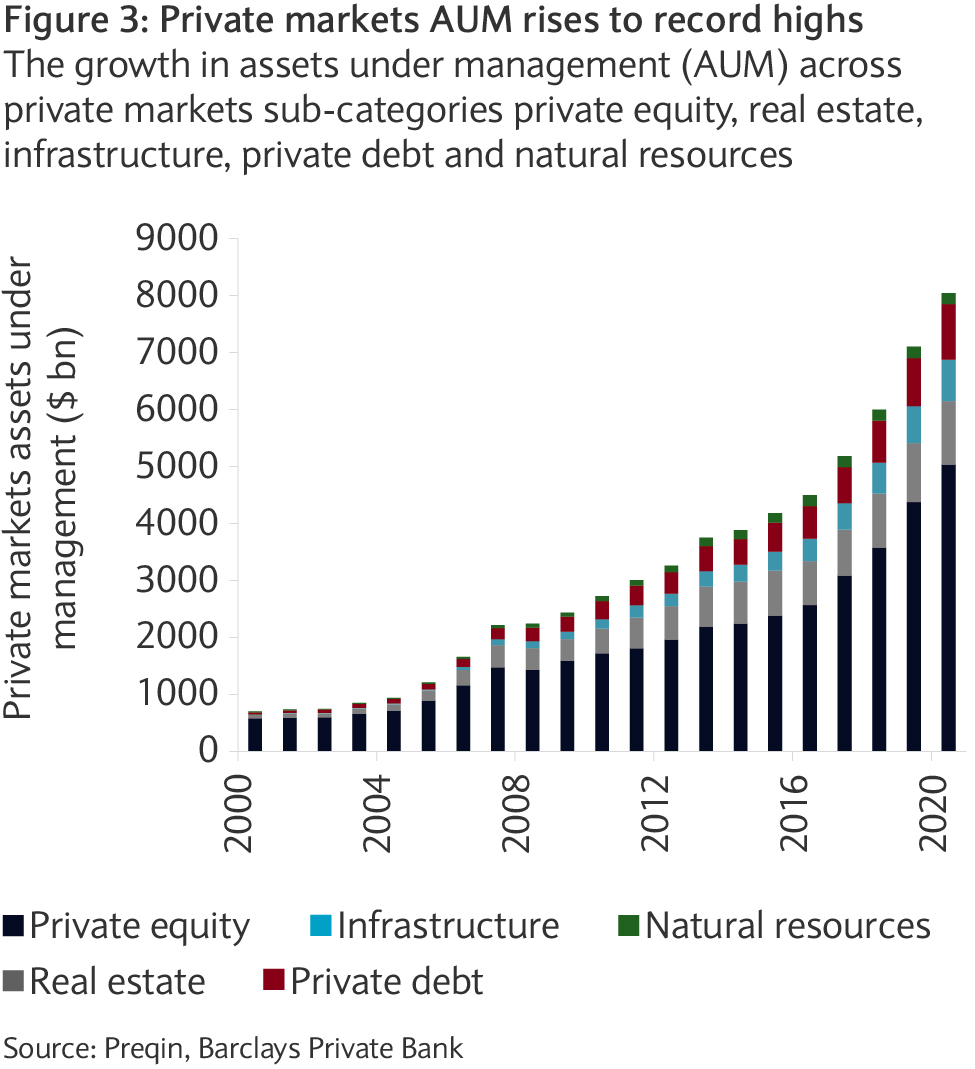
Given our view in the May’s Market Perspectives of smart infrastructure leading returns in the next decade, its CAGR of 24.7% during the same period is worth noting.
Harvesting PE’s liquidity premium
We can see quite clearly the appeal private markets have. Over the longer term they provide higher returns, lower volatility and much more exposure to companies than public markets.
However, one cannot ignore that similar to hedge funds, each investment is very diverse and heterogeneous.
High performance dispersion is the key to unlocking alpha generation potential. Skilled managers who have informational advantage and expertise in identifying entrepreneurial skill can significantly enhance returns through the selection process and active management.
The data supports the notion that private markets can diversify portfolios, enhance the risk-return profile and give investors exposure to niche companies. However, private markets are a long-term proposition. In particular, short termism and financial conservatism do not bode well with investments in PE.
Instead, investors with long-term aspirations and liabilities, possess the capacity to hold illiquid assets in their portfolios and can make significant capital commitments, seem best positioned to harvest PE’s liquidity premium.
Investor sentiment has subsided as inflationary pressures build. Our investment experts highlight our main investment themes, examining if consumers can drive the recovery.
This communication:
Any past or simulated past performance including back-testing, modelling or scenario analysis, or future projections contained in this communication is no indication as to future performance. No representation is made as to the accuracy of the assumptions made in this communication, or completeness of, any modelling, scenario analysis or back-testing. The value of any investment may also fluctuate as a result of market changes.
Barclays is a full service bank. In the normal course of offering products and services, Barclays may act in several capacities and simultaneously, giving rise to potential conflicts of interest which may impact the performance of the products.
Where information in this communication has been obtained from third party sources, we believe those sources to be reliable but we do not guarantee the information’s accuracy and you should note that it may be incomplete or condensed.
Neither Barclays nor any of its directors, officers, employees, representatives or agents, accepts any liability whatsoever for any direct, indirect or consequential losses (in contract, tort or otherwise) arising from the use of this communication or its contents or reliance on the information contained herein, except to the extent this would be prohibited by law or regulation. Law or regulation in certain countries may restrict the manner of distribution of this communication and the availability of the products and services, and persons who come into possession of this publication are required to inform themselves of and observe such restrictions.
You have sole responsibility for the management of your tax and legal affairs including making any applicable filings and payments and complying with any applicable laws and regulations. We have not and will not provide you with tax or legal advice and recommend that you obtain independent tax and legal advice tailored to your individual circumstances.
THIS COMMUNICATION IS PROVIDED FOR INFORMATION PURPOSES ONLY AND IS SUBJECT TO CHANGE. IT IS INDICATIVE ONLY AND IS NOT BINDING.