Managed futures: Portfolio diversifier?
22 February 2023
By Lukas Gehrig, Zurich Switzerland, Quantitative Strategist; Nikola Vasiljevic, PhD, Zurich, Switzerland, Head of Quantitative Strategy
Please note: This communication is for our more investment-savvy readers, due to its highly technical nature. Managed futures is a trend-following strategy involving futures contracts, which are not appropriate to most retail investors. Moreover, it is complex to implement and requires high levels of sophistication, market data access as well as robust risk-management tools. This communication is general in nature and provided for information/educational purposes only. It does not take into account any specific investment objectives, the financial situation or particular needs of any particular person. It is not intended for distribution, publication, or use in any jurisdiction where such distribution, publication, or use would be unlawful, nor is it aimed at any person or entity to whom it would be unlawful for them to access.
Managed futures describe a hedge fund style which employs qualitative or quantitative methods to identify trends in economic variables, and the impact they have on financial markets. They fall under the category of macro hedge funds and are also referred to as Commodity Trading Advisors (CTAs). Contrary to their second name, they are not confined to investments in commodities but trade mostly equity and bond futures.
Managed futures strategies are typically implemented in the futures markets to express views on the continuation of identified trends. The biggest difference to other hedge fund styles, such as relative value strategies, is that managed futures primarily focus on trends, while mostly ignoring valuations.
Thriving with strong trends
One major appeal of managed futures is that they are agnostic to the overall market direction. This makes them a source of – nowadays highly coveted – uncorrelated returns. By following trends – either up or down – the strategy aims to perform as long as the direction of travel is clearly defined.
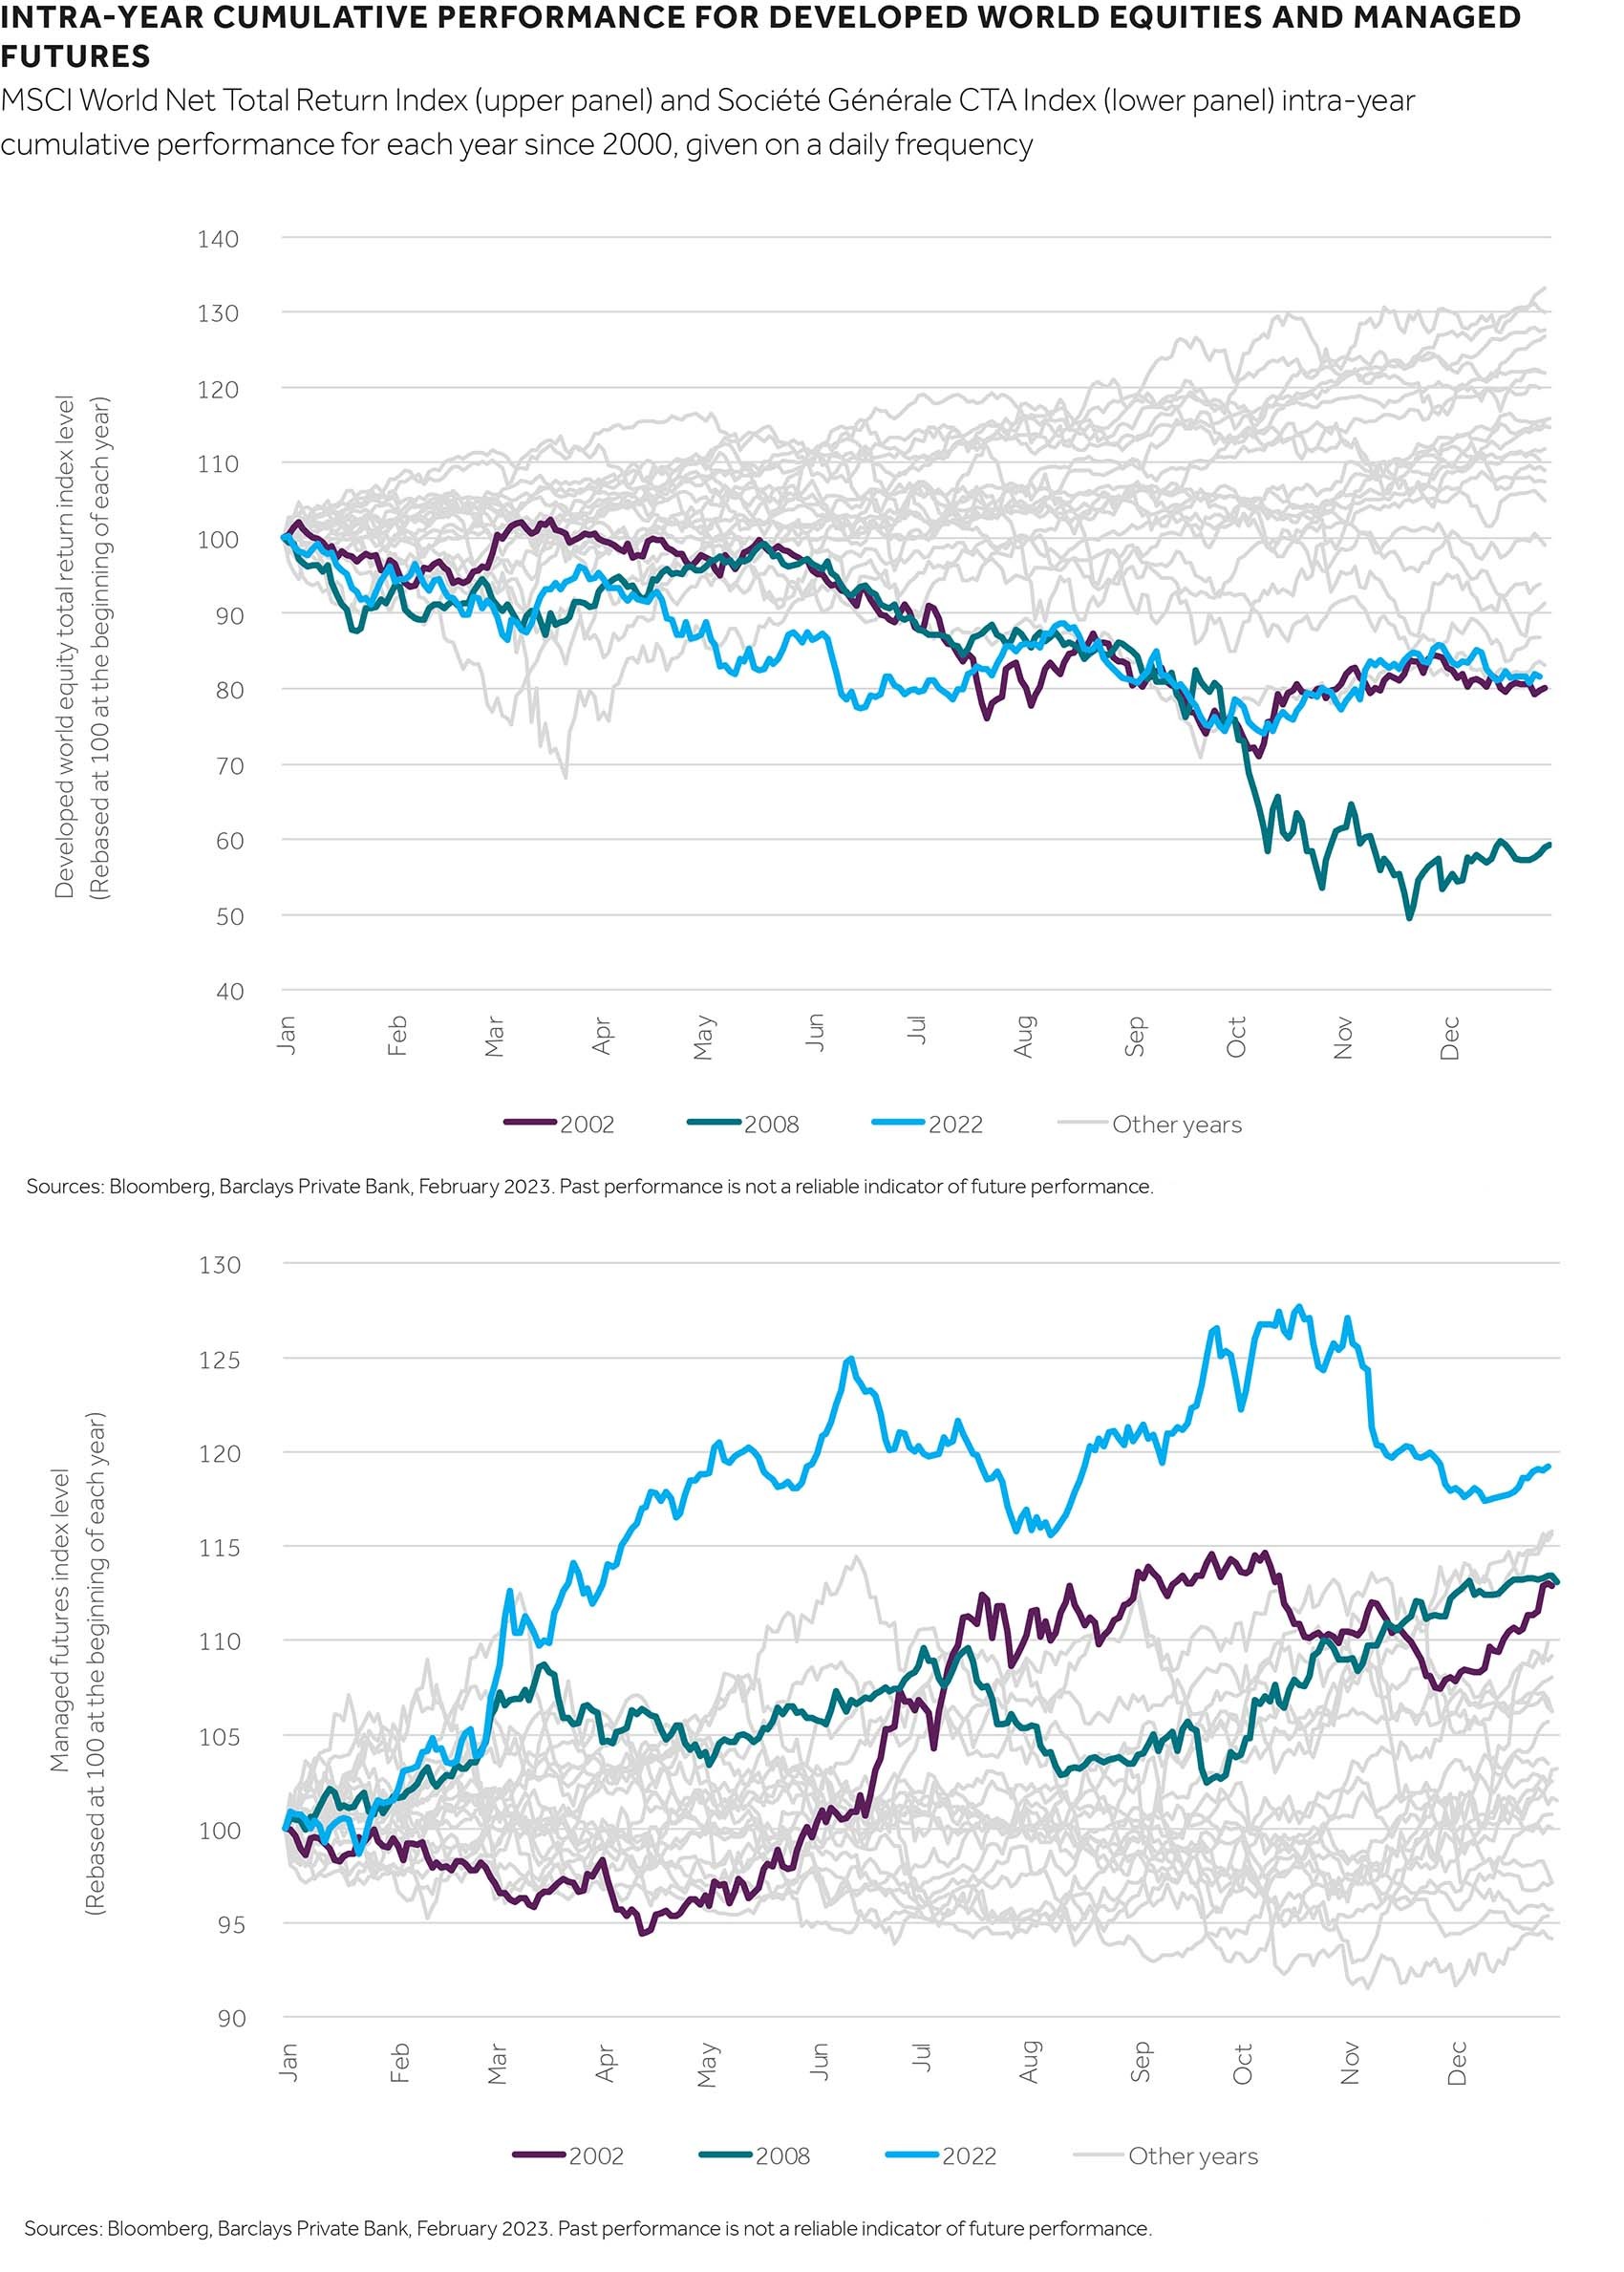
In markets without a clear direction, trend-following strategies struggle, which leads to the typical “smile” profile for managed futures returns - that is, one with a convex pay-off against broad equity market performance (see chart)1.

Source: Bloomberg, Barclays Private Bank, February 2023. Past performance is not a reliable indicator of future performance
The quest for uncorrelated returns
Having portfolio assets with a low correlation to equities is a highly sought-after characteristic these days, given the challenging macroeconomic climate. Historically, managed futures strategies have performed well when stocks have suffered the most (see chart).
By focusing on the last two decades, we can see that managed futures posted double-digit returns during the bursting of the dot-com bubble in 2002, and at the peak of the global financial crisis in 2008. Moreover, their best year-to-date performance was recorded in 2022, in an era characterised by a positive correlation between equities and bonds. As such, managed futures were one of the best performing investment strategies last year. The worst years for managed futures included 2018 or 2011 – periods that were characterised by volatile growth dynamics and relatively weak inflation.

Indeed, this timely example shows that uncorrelated returns could hold the key to successful investing in stressed markets. But what are the ingredients for uncorrelated returns? Two considerations, regarding correlation, can help to understand how trend-following strategies typically aim to add value to a portfolio.
Macro-neutral returns
First, let’s look at the origins of correlations between broad market indices and macro factors. In How to diversify investments whatever the macro weather, we showed how simple macro factors can be built from data on industrial production, inflation, inflation surprises, the fed funds rate, as well as the monetary aggregate M2, which essentially tracks the amount of money circulating in the economy. This allowed us to derive partial correlations between financial market returns and the three main macroeconomic factors – growth, inflation and monetary policy stimulus.
The above approach uncovers the main apparent reason for the highly unusual losses seen in both equities and bonds in 2022 – both asset classes are very negatively associated with the inflation factor. It also highlights that many parts of the investment universe share this weakness to inflation, a link that is obvious when looking at partial correlations. Had standard Pearson’s correlation coefficients been used instead, the fact that inflation is typically accompanied by strong growth would have diluted these findings.
In this sense, managed futures indices offer a unique blend of neutrality to all macro drivers and therefore could add an uncorrelated source of return, in the macro sense.

Non-standard premia harvest
Another approach to understanding the key drivers of correlations is to analyse cross-asset risk premia, which represent the ultimate return sources.
Looking at differences in realised returns between government bonds and cash rates (term premium), high yield bonds and government bonds (credit premium), equities, and high yield bonds (equity premium), and adding the returns of a short volatility strategy on top (variance premium), is a simple way to find the most common risk premia that different investments can collect2.
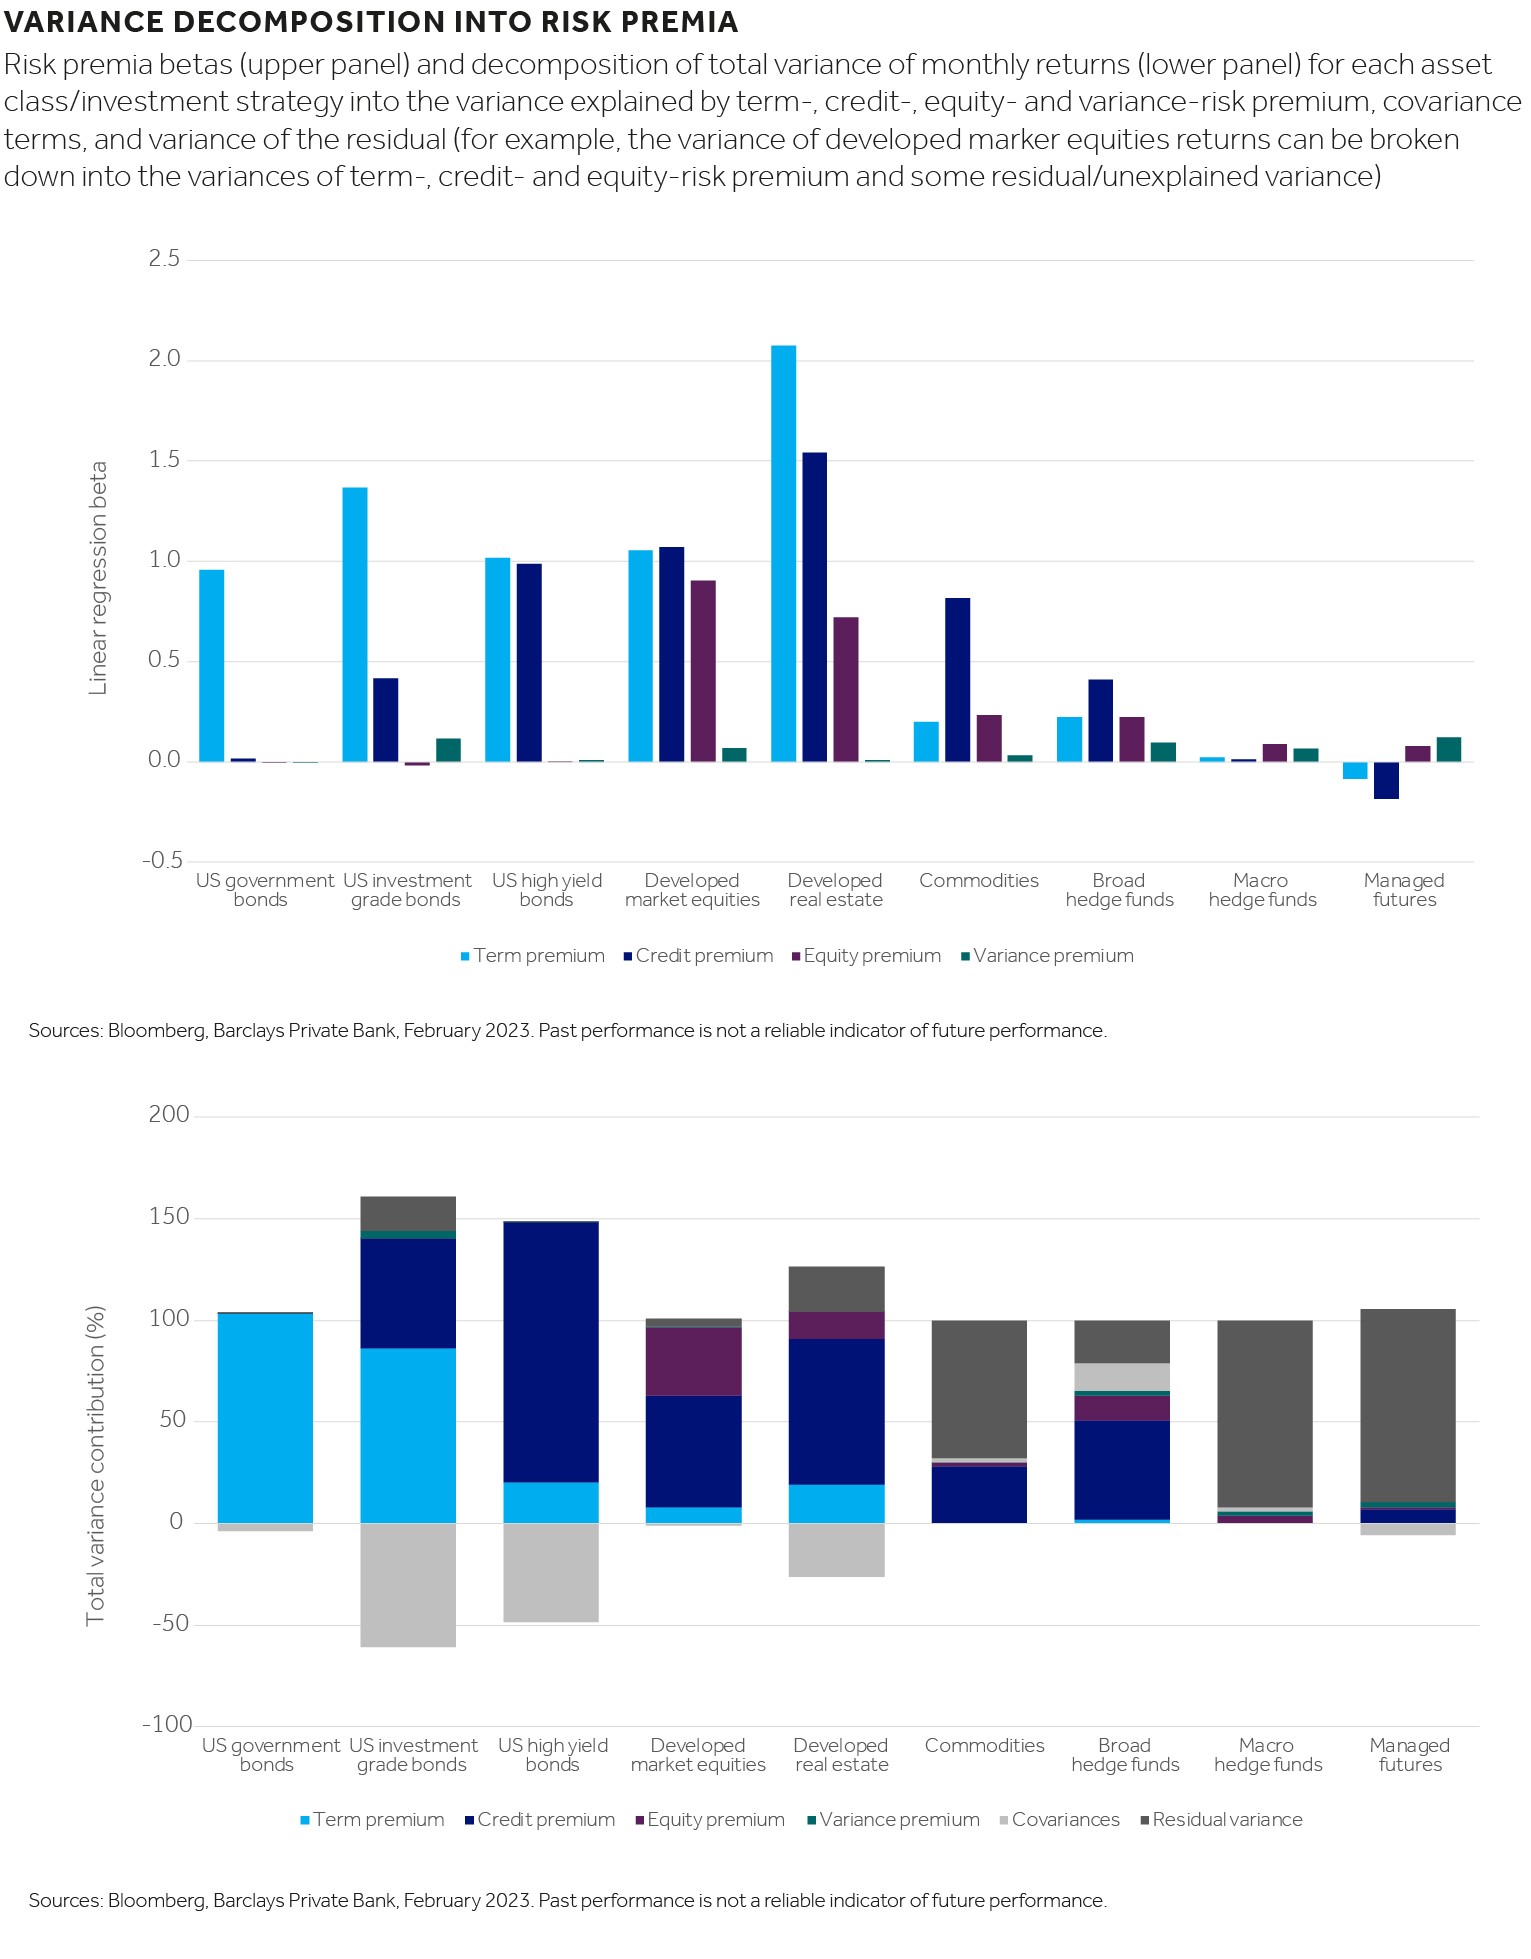
Regressing the monthly returns of an investment strategy onto these risk premia can help to show the sources of return that make up the performance of an asset. While government bonds are harvesting the term premium exclusively, the typical risk-on asset is collecting a mixture of term premium, credit premium and equity premium (see variance decompositions, in chart).
In our calculations, term premium is based on developed government bonds versus USD cash; for credit premium, US high yield bonds versus US government bonds; for equity premium, US equities versus US high yield bonds, and for variance premium, a short volatility index is used.

Interestingly, the above risk premia regressions can explain the returns of bonds, equities, real estate and even hedge funds very well (model R2 in excess of 0.7). They struggle to explain overall commodity returns and they fail when applied to macro hedge funds and managed futures strategies (model R2 is below 0.1).
This is insightful because it tells us that these strategies harvest returns that are very different to what the more standard asset classes are collecting.
Managed futures in a portfolio context
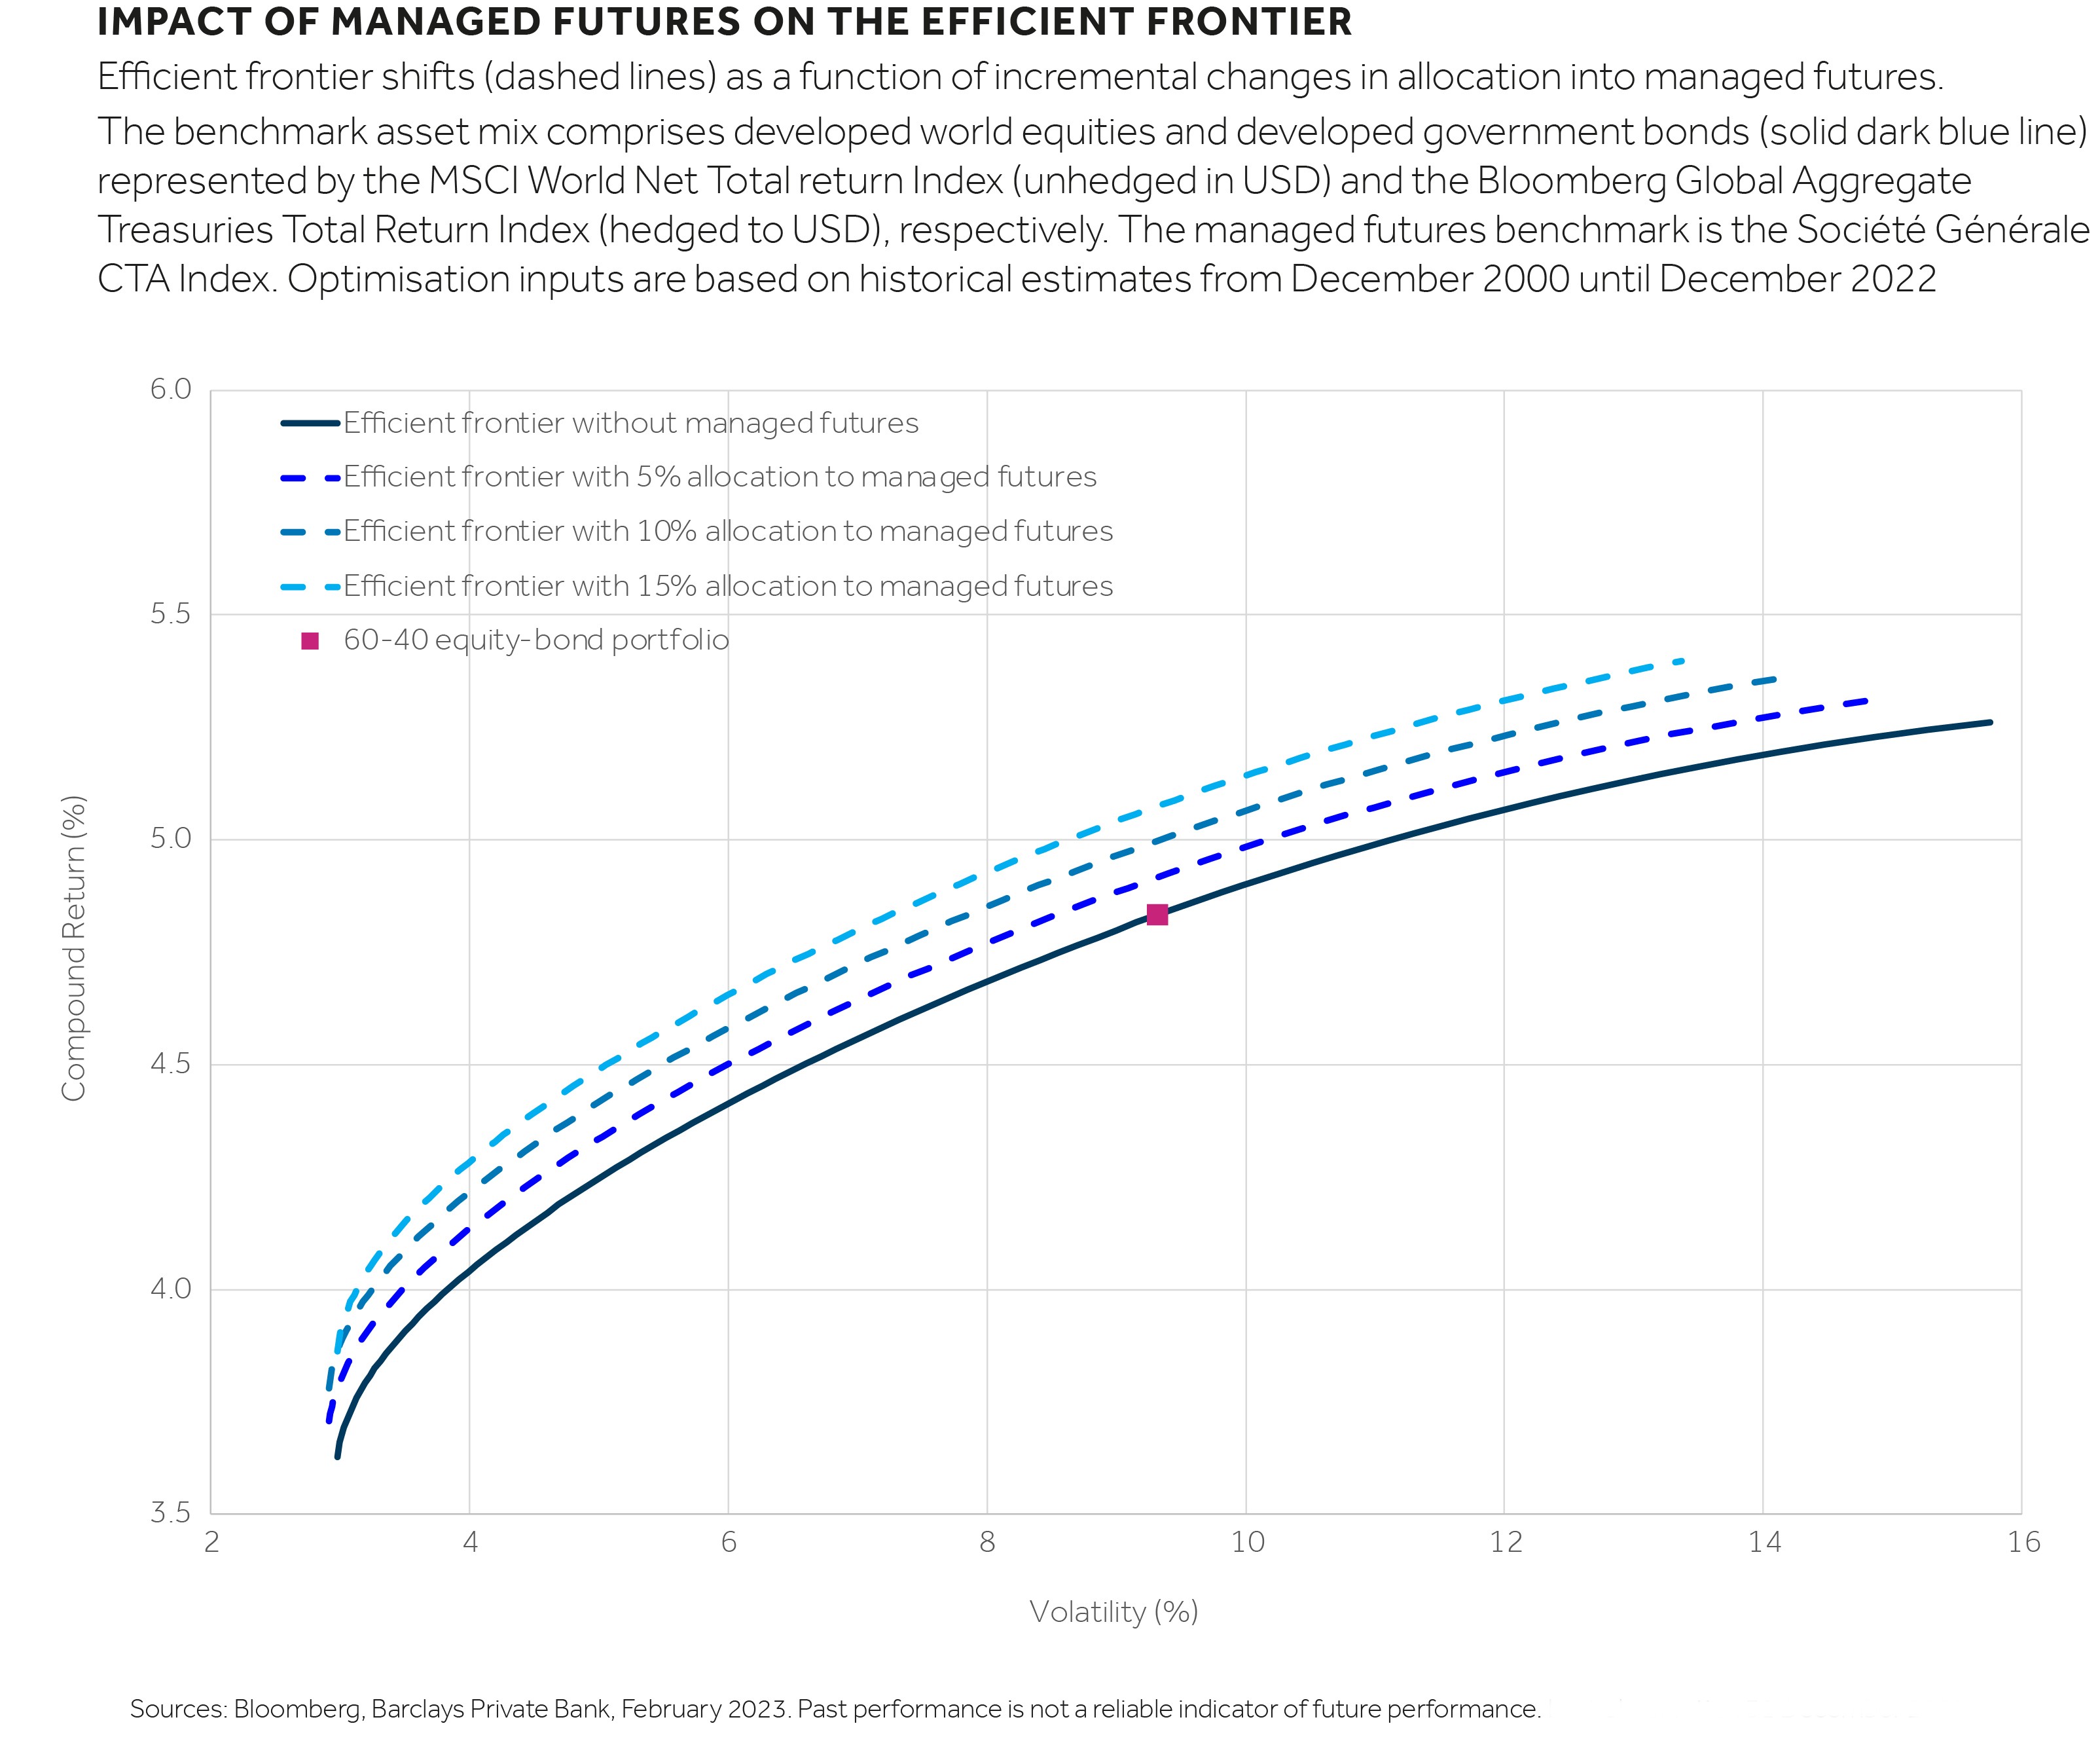
From a portfolio construction perspective, adding such an inherently different source of return can help to produce a portfolio that is expected to lower risk for a given expected return, or “shift the efficient frontier up”, to use financial terminology.
More specifically, adding a managed futures allocation to a traditional equity-bond portfolio can improve portfolio diversification by adding a new source of return. Our findings show that adding a 5% allocation to managed futures, for example, could enhance overall expected returns by around 5-10 basis points (subject to external conditions, and portfolio management strategy, each being conducive).

That said, a diverse source of performance also adds a new source for when portfolio returns hit trouble. Such bad times, for managed futures, are located at the bottom of the smile profile from the first chart. But if an investor can stomach low returns during a period without a clear trend, the benefits of managed futures could be considered from a portfolio construction point of view.
Outperformance from macro-neutral strategies, when all else fails, seems attractive. But, can last year’s outperformance last, or is it too late to allocate to it now?
It depends on your view on growth… and inflation
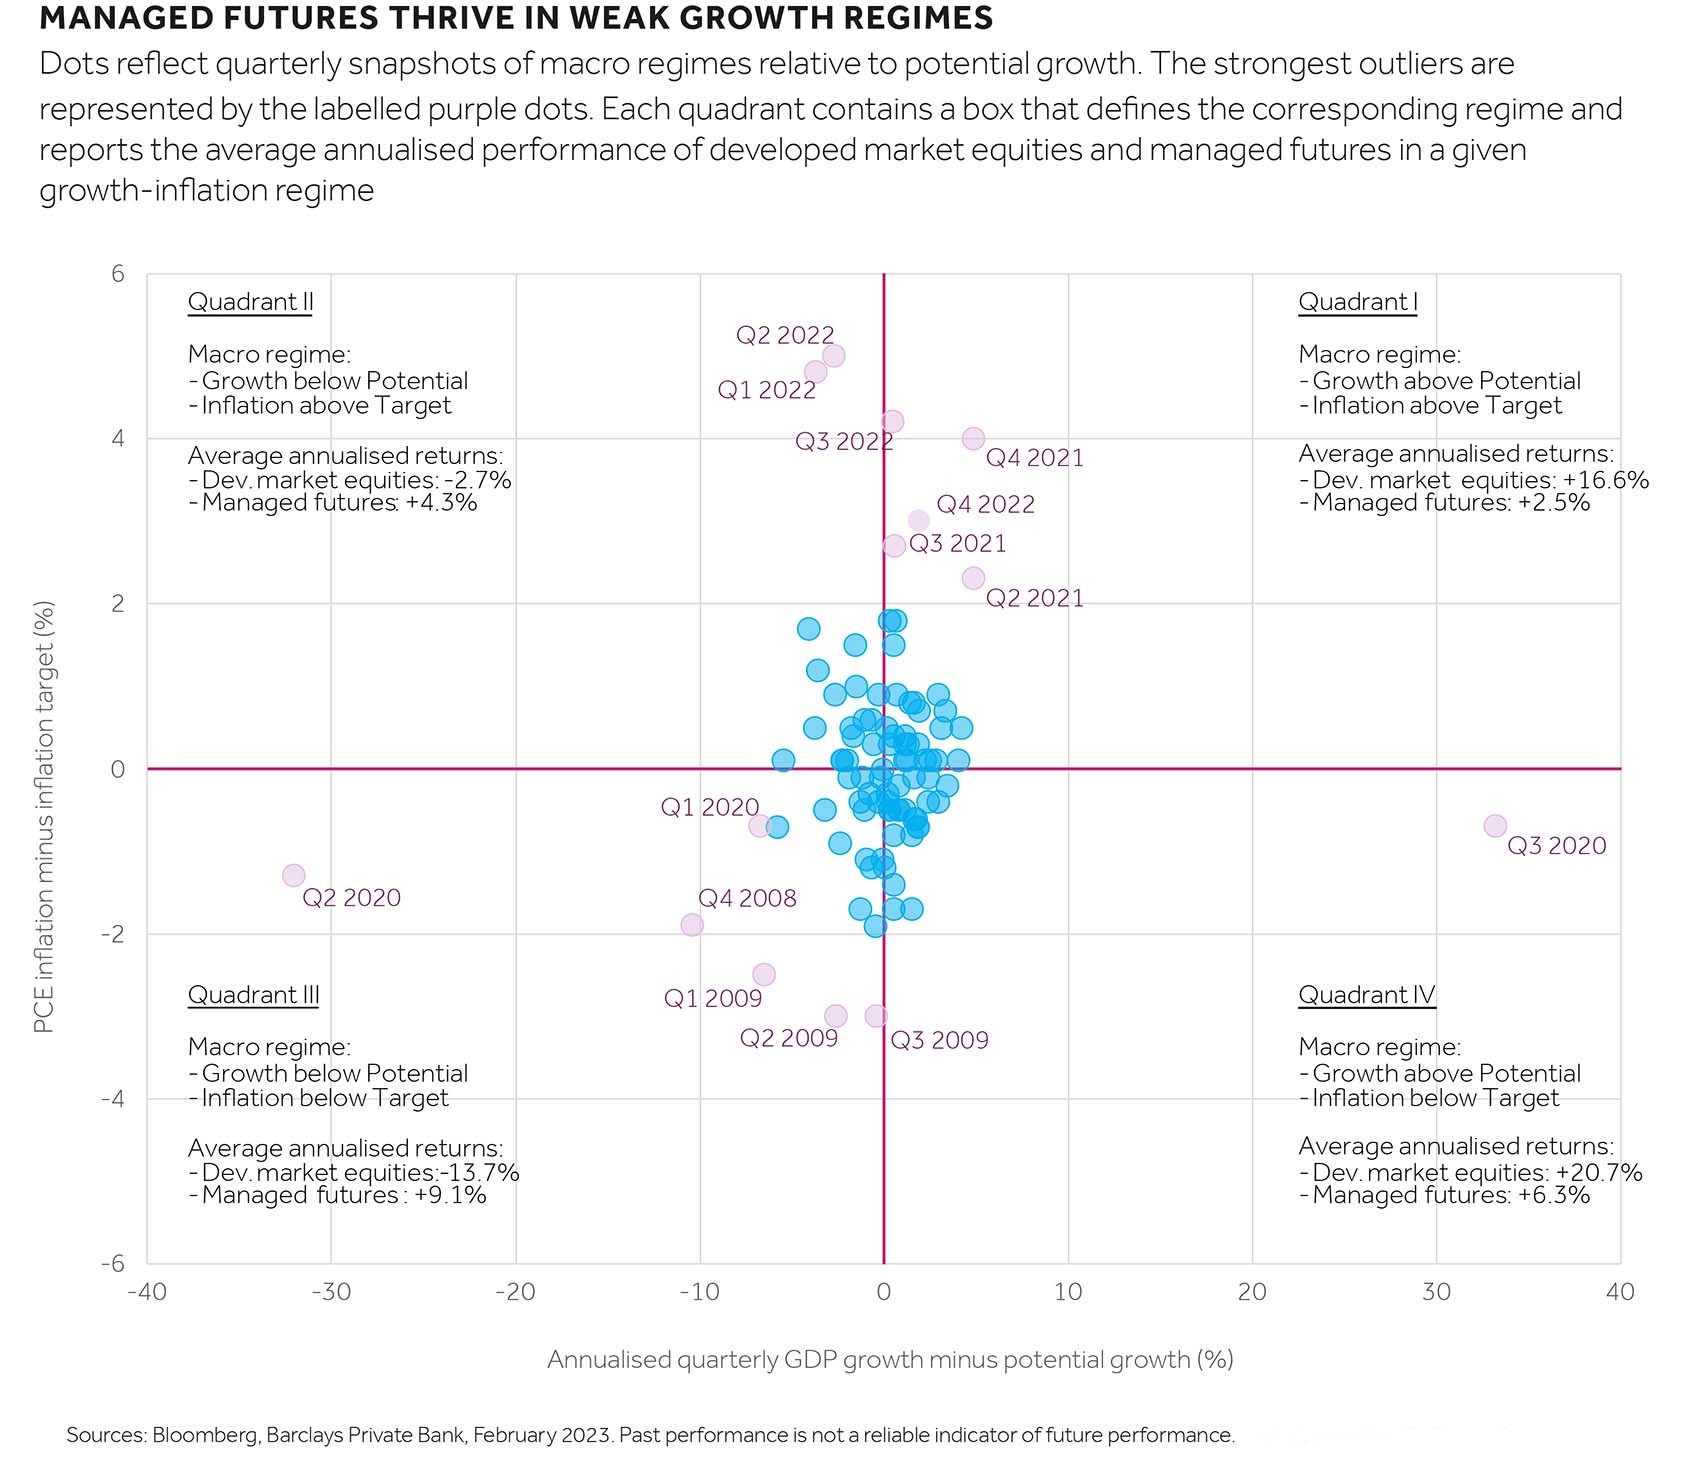
Whether investments into managed futures make sense over the short-to-medium term depends on your expectations for the economy. This can be demonstrated by breaking down the returns of managed futures and developed market equities by macro regimes (see chart).
To establish different macro regimes, we observe whether gross domestic product growth was in excess of the (time-varying) potential growth estimate by the Bloomberg Economics unit, and whether personal consumption expenditure (PCE) inflation was above or below the inflation target set by the US Federal Reserve.

Managed futures returns have been positive across all four macro regimes identified in the chart. This result explains why managed futures are often referred to as “absolute return” strategies.
However, our analysis shows that managed futures typically tend to thrive in weak growth environments, especially relative to developed market equities. Therefore, in an anticipated phase of below-potential growth, managed futures could provide an alternative to a broad equity basket.
That said, continuously strong macro performance and a mild slowdown – as seen in the final quarter of last year, when managed futures returns receded – would be a reason not to invest in managed futures.
What future holds for managed futures?
Our quantitative analysis is purely based on historical data spanning the last 20 years, a time that was marked by solidly anchored inflation expectations. As such, the ongoing de-anchoring of inflation expectations may make the coming decade different from the last two.
Arguably, confidence in the ability of developed market central banks to hit their inflation target is at rock bottom, as is portrayed in recent inflation expectation surveys conducted by the Federal Reserve Bank of Philadelphia, since the inception of the managed futures benchmark we used (the Société Générale CTA Index) in the early 2000s. This may contribute to a phase of elevated volatility in inflation and create a happy hunting ground for trend-following strategies.
Disclaimer
This communication is general in nature and provided for information/educational purposes only. It does not take into account any specific investment objectives, the financial situation or particular needs of any particular person. It not intended for distribution, publication, or use in any jurisdiction where such distribution, publication, or use would be unlawful, nor is it aimed at any person or entity to whom it would be unlawful for them to access.
This communication has been prepared by Barclays Private Bank (Barclays) and references to Barclays includes any entity within the Barclays group of companies.
This communication:
(i) is not research nor a product of the Barclays Research department. Any views expressed in these materials may differ from those of the Barclays Research department. All opinions and estimates are given as of the date of the materials and are subject to change. Barclays is not obliged to inform recipients of these materials of any change to such opinions or estimates;
(ii) is not an offer, an invitation or a recommendation to enter into any product or service and does not constitute a solicitation to buy or sell securities, investment advice or a personal recommendation;
(iii) is confidential and no part may be reproduced, distributed or transmitted without the prior written permission of Barclays; and
(iv) has not been reviewed or approved by any regulatory authority.
Any past or simulated past performance including back-testing, modelling or scenario analysis, or future projections contained in this communication is no indication as to future performance. No representation is made as to the accuracy of the assumptions made in this communication, or completeness of, any modelling, scenario analysis or back-testing. The value of any investment may also fluctuate as a result of market changes.
Where information in this communication has been obtained from third party sources, we believe those sources to be reliable but we do not guarantee the information’s accuracy and you should note that it may be incomplete or condensed.
Neither Barclays nor any of its directors, officers, employees, representatives or agents, accepts any liability whatsoever for any direct, indirect or consequential losses (in contract, tort or otherwise) arising from the use of this communication or its contents or reliance on the information contained herein, except to the extent this would be prohibited by law or regulation.
Important information
-
We use the Société Générale CTA Index as the proxy for managed futures. This index has become the industry benchmark for this type of investment strategy. It is a daily, equal-weighted index based on a group of 20 CTAs selected from the largest managers. As such, it is not directly investable and our results should be interpreted with that caveat in mind. Nevertheless, the risk from picking one single manager can easily offset the benefits of an overall uncorrelated strategy. For this reason, we think that using a diversified benchmark, such as Société Générale CTA Index, provides a better reference point for managed futures as a sub-asset class within the hedge funds universe.Return to reference
-
Risk premia can be defined and measured in different ways. Our incremental approach captures the marginal contributions of each asset class return on top of the others (where asset classes are ordered by their market risk).Return to reference