-

How to diversify investments whatever the macro weather

01 October 2021

By Lukas Gehrig, Zurich Switzerland, Quantitative Strategist; Nikola Vasiljevic, Zurich, Switzerland, Head of Quantitative Strategy

You’ll find a short briefing below. To read the full article, please select the ‘full article’ tab.

  • Summary
    • The best advice for building a robust portfolio has typically been to diversify across different asset classes rather than putting all your eggs into one basket
    • However, financial markets are becoming more correlated, making it harder to diversify investments
    • Macroeconomic factors are driving this increased correlation between stocks, bonds and other asset classes
    • Yet, portfolios can still be tweaked to smooth the ups and downs of the market and deal with any macro “weather”
  • Full article

    Financial markets are far more correlated than they were in the 2000s. This poses challenges for diversification that needs an additional lens to analyse dependencies. General macroeconomic indicators can inform macro-dependent investment decisions.

    The best advice for building a robust portfolio has always been to diversify across different asset classes rather than putting all your eggs into one basket.

    As we have argued several times in previous Market Perspectives, diversification has become even more important with the increased globalisation of financial markets. It is well known that diversifying investments beyond a simple mix of equities and bonds offers both opportunities and risks that can strengthen the robustness of a portfolio.

    Global financial crisis made its mark

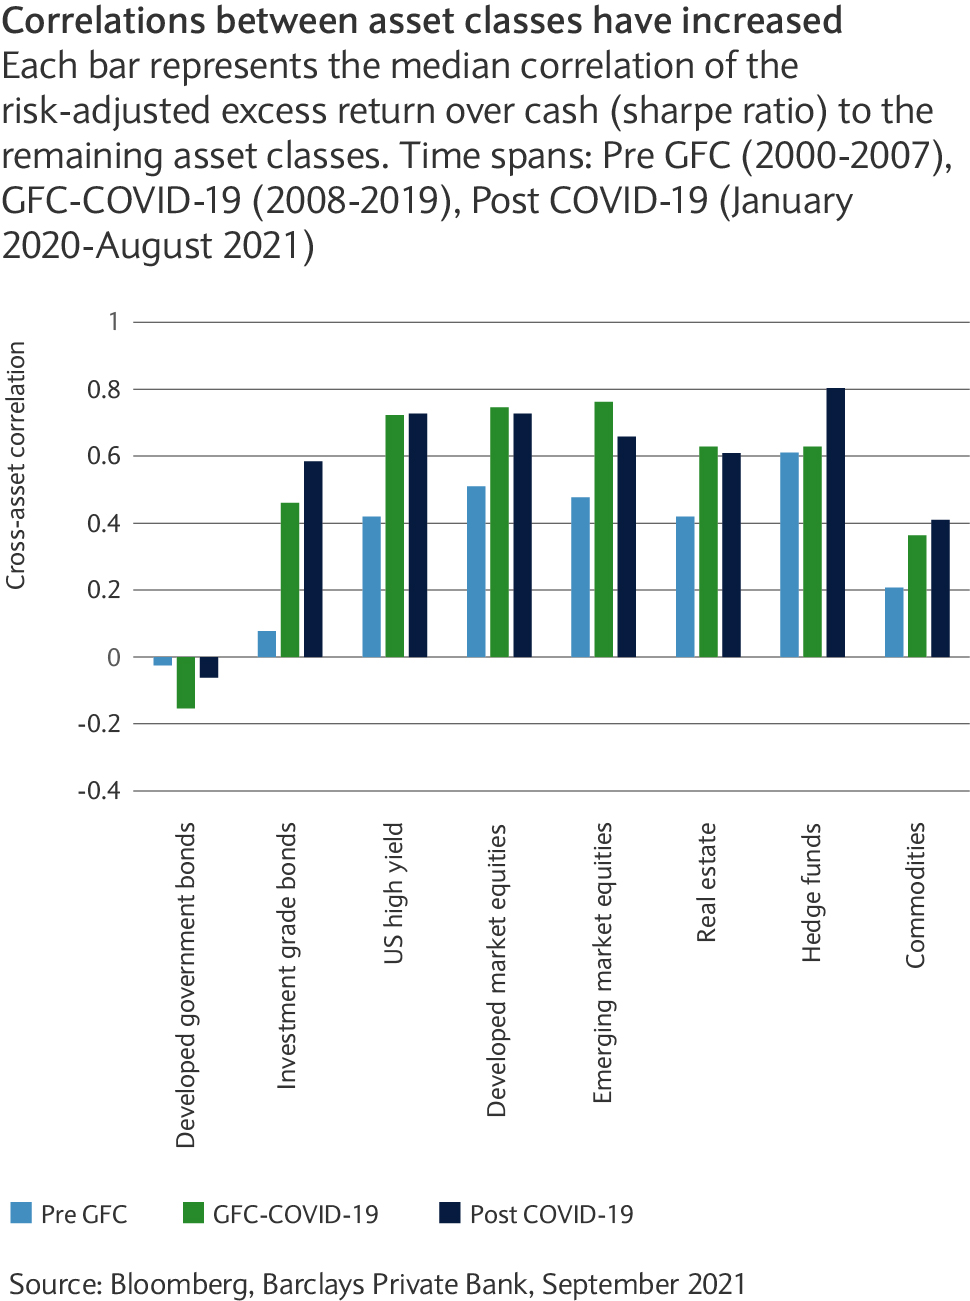
    A less well-known fact is that the correlation between asset classes has increased considerably since the early 2000s. Looking at three distinct periods this century, before the global financial crisis (GFC), between then and the pandemic onset and then since, shows the different correlations between the returns on one-out-of-eight key asset classes against the others (see chart). We have chosen the broad asset classes that would be represented in a typical US dollar.

    The blue bars represent the years 2000 until the onset of the GFC. Asset classes like government or investment grade bonds and commodities exhibited only benign correlation to the returns of the other asset classes. This implies that they are good diversifiers for riskier assets, such as high yield credit or equities.

    Market interventions increased cross-correlations

    The green bars for the inter-crises period show a significant increase in correlation across asset classes. And, while still very short in history, the dark blue bars for the post-COVID-19 period suggest that cross- correlations have risen even more since the outbreak of COVID-19 and the policy responses to it.

    This change in correlations, brought about by quantitative easing intended for asset price stabilisation and unprecedented government spending programmes, has undoubtedly made diversification more difficult to achieve.

    Macroeconomic regimes can explain asset co-movement

    While there are sources of uncorrelated opportunities that can be tapped in private markets, these are tailored solutions, which would be difficult to replicate for many investors. Another popular solution to the above-mentioned diversification problem does not actually introduce new, uncorrelated risks, but seeks to better understand the drivers of the co-movement.

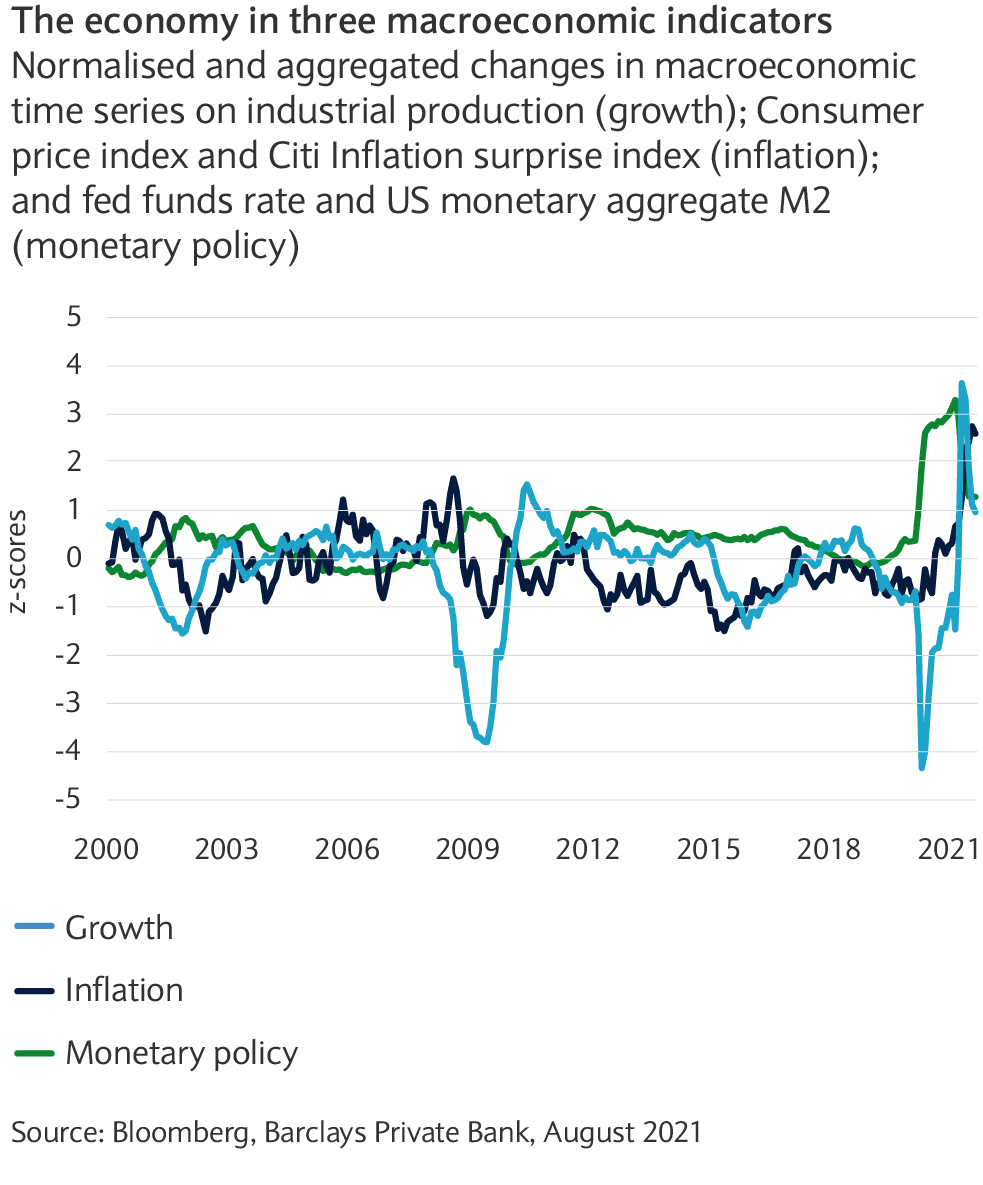
    Traditionally, growth and inflation are used as macroeconomic indicators, driving returns in financial markets. Indeed, growth (or surprises therein) can explain a large share of the co-movement of risky assets, while inflation can be cited for outperformance of real assets such as commodities. But there is a third driver: monetary policy (see chart).

    A question of design

    In building these macroeconomic indicators, we made a host of assumptions that can influence any subsequent analysis. We selected well-known US indicators, transformed them to year-on-year change basis (where necessary) and normalised the indicators to a mean of zero and comparable variance.

    These indicators work well in explaining co-movement in our key asset classes at a medium-term horizon (say six months), where many single event-shocks not captured by the indicators are smoothed out. A much more reactive set of macroeconomic indicators would be needed to explain co-movement on a monthly, weekly or even daily basis.

    The real, the cyclical or the risky

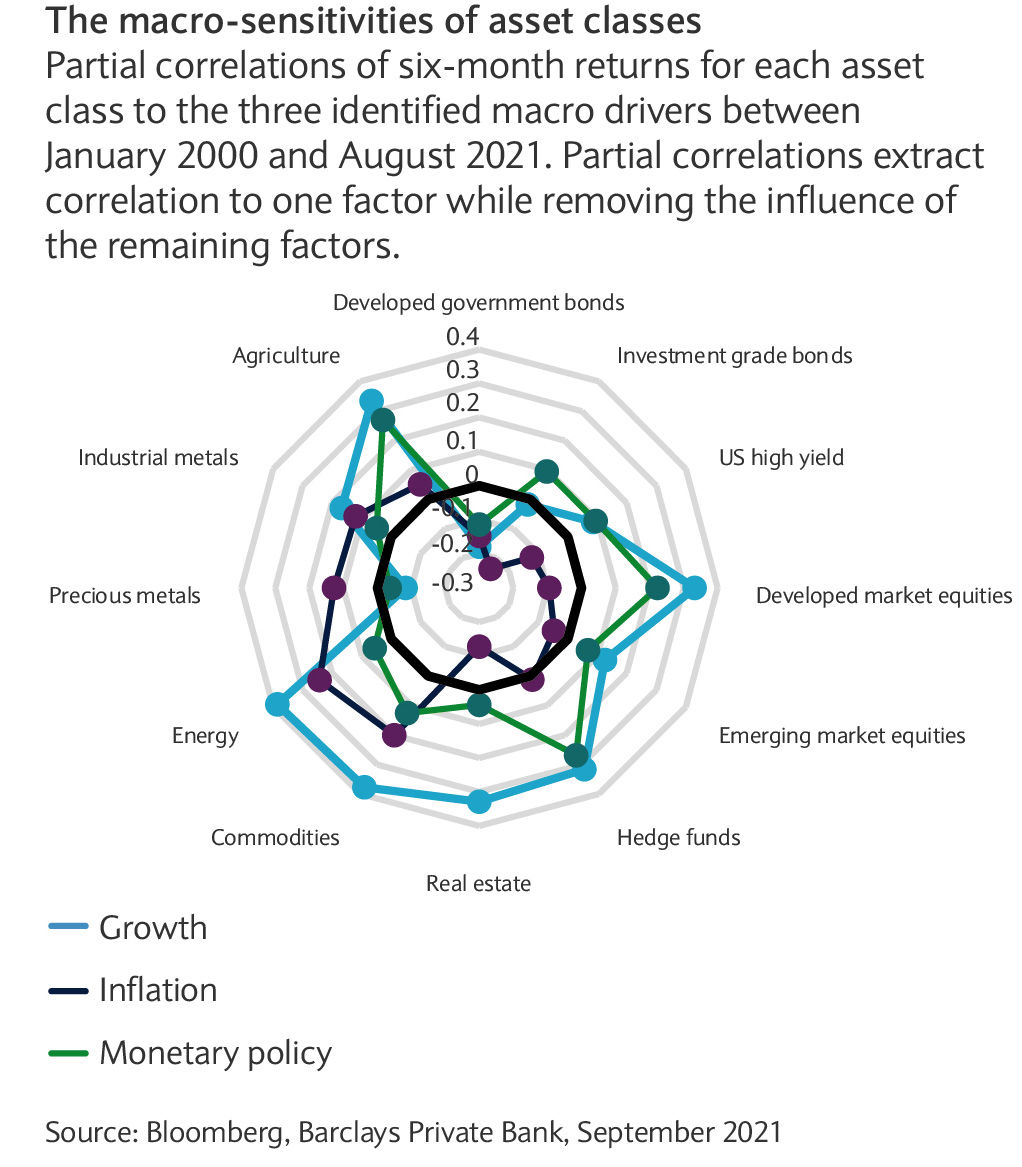
    This chart visualises the partial correlations between the returns of each asset class and the three macroeconomic indicators. The highlighted black circle marks the zero-line. Points outside of this circle mean positive correlation and vice-versa.

    It should come as no surprise that inflation is most negatively correlated with fixed income assets, while being positively correlated with commodities. Growth is most positively related with equities, cyclical commodities and real estate while weighing on returns of gold. Easy monetary policy created an environment where riskier fixed income and equities thrive, while returns on developed government bonds falter.

    Patterns to be exploited with a tactical tilt

    The prior analysis shows that asset classes have become more correlated over time and that groups of asset classes (perhaps risky, cyclical or real assets) are associated with specific macro “weather”. We can use this information to help devise a tactical overlay to any given portfolio, overweighting assets that benefit from the current environment.

    But there’s more to it

    The above macroeconomic indicators have become more correlated over time: especially inflation, which has been more correlated to growth and monetary policy in the last decade. Clearly, when everything is correlated, including the underlying macroeconomic drivers, one would be tempted to focus on the high-returning assets.

    However, this correlation of macro indicators may reverse. If so, it may be worth making diversification decisions in a portfolio context dependent on both the prevalence and co-movement of macro indicators. But this is something for a later article in this series.

""

Market Perspectives October 2021

Our investment experts highlight our main investment themes, looking at how investors can play their part in tackling climate change, if proposed tax hikes might hit equity valuations, bonds fit for this stage in the credit cycle and whether surging energy prices threaten the economic recovery.

Related articles

Investments can fall as well as rise in value. Your capital or the income generated from your investment may be at risk.

This communication:

  • Has been prepared by Barclays Private Bank and is provided for information purposes only
  • Is not research nor a product of the Barclays Research department. Any views expressed in this communication may differ from those of the Barclays Research department
  • All opinions and estimates are given as of the date of this communication and are subject to change. Barclays Private Bank is not obliged to inform recipients of this communication of any change to such opinions or estimates
  • Is general in nature and does not take into account any specific investment objectives, financial situation or particular needs of any particular person
  • Does not constitute an offer, an invitation or a recommendation to enter into any product or service and does not constitute investment advice, solicitation to buy or sell securities and/or a personal recommendation.  Any entry into any product or service requires Barclays’ subsequent formal agreement which will be subject to internal approvals and execution of binding documents
  • Is confidential and is for the benefit of the recipient. No part of it may be reproduced, distributed or transmitted without the prior written permission of Barclays Private Bank
  • Has not been reviewed or approved by any regulatory authority.

Any past or simulated past performance including back-testing, modelling or scenario analysis, or future projections contained in this communication is no indication as to future performance. No representation is made as to the accuracy of the assumptions made in this communication, or completeness of, any modelling, scenario analysis or back-testing. The value of any investment may also fluctuate as a result of market changes.

Barclays is a full service bank.  In the normal course of offering products and services, Barclays may act in several capacities and simultaneously, giving rise to potential conflicts of interest which may impact the performance of the products.

Where information in this communication has been obtained from third party sources, we believe those sources to be reliable but we do not guarantee the information’s accuracy and you should note that it may be incomplete or condensed.

Neither Barclays nor any of its directors, officers, employees, representatives or agents, accepts any liability whatsoever for any direct, indirect or consequential losses (in contract, tort or otherwise) arising from the use of this communication or its contents or reliance on the information contained herein, except to the extent this would be prohibited by law or regulation. Law or regulation in certain countries may restrict the manner of distribution of this communication and the availability of the products and services, and persons who come into possession of this publication are required to inform themselves of and observe such restrictions.

You have sole responsibility for the management of your tax and legal affairs including making any applicable filings and payments and complying with any applicable laws and regulations. We have not and will not provide you with tax or legal advice and recommend that you obtain independent tax and legal advice tailored to your individual circumstances.

THIS COMMUNICATION IS PROVIDED FOR INFORMATION PURPOSES ONLY AND IS SUBJECT TO CHANGE. IT IS INDICATIVE ONLY AND IS NOT BINDING.