Inflation: Learning from the 1970s
25 July 2022
By Lukas Gehrig, Zurich Switzerland, Quantitative Strategist; Nikola Vasiljevic, Zurich, Switzerland, Head of Quantitative Strategy
In the following article, we argue that to understand the current inflation crisis, one has to study price dynamics around the oil shocks in the 1970s. Equipped with data-driven insights from that decade, the trade-offs for today’s policy makers emerge more clearly. This enables us to think in scenarios and diversify portfolios to face the risks ahead.
Please note: This communication is general in nature and provided for information/educational purposes only. It does not take into account any specific investment objectives, the financial situation or particular needs of any particular person. It is not intended for distribution, publication, or use in any jurisdiction where such distribution, publication, or use would be unlawful, nor is it aimed at any person or entity to whom it would be unlawful for them to access.
Inflation is the dominating topic in markets this year and market consensus, central banks, professional forecasters as well as consumers have been caught out numerous times. The current inflation turmoil started out with an unusual set of circumstances: lockdowns waylaying global supply chains with repercussions for goods prices, and service sector prices jumping back to life in the re-opening of businesses. These were new experiences that made us ponder the future of globalised trade but there was a general consensus that it would peter out eventually.
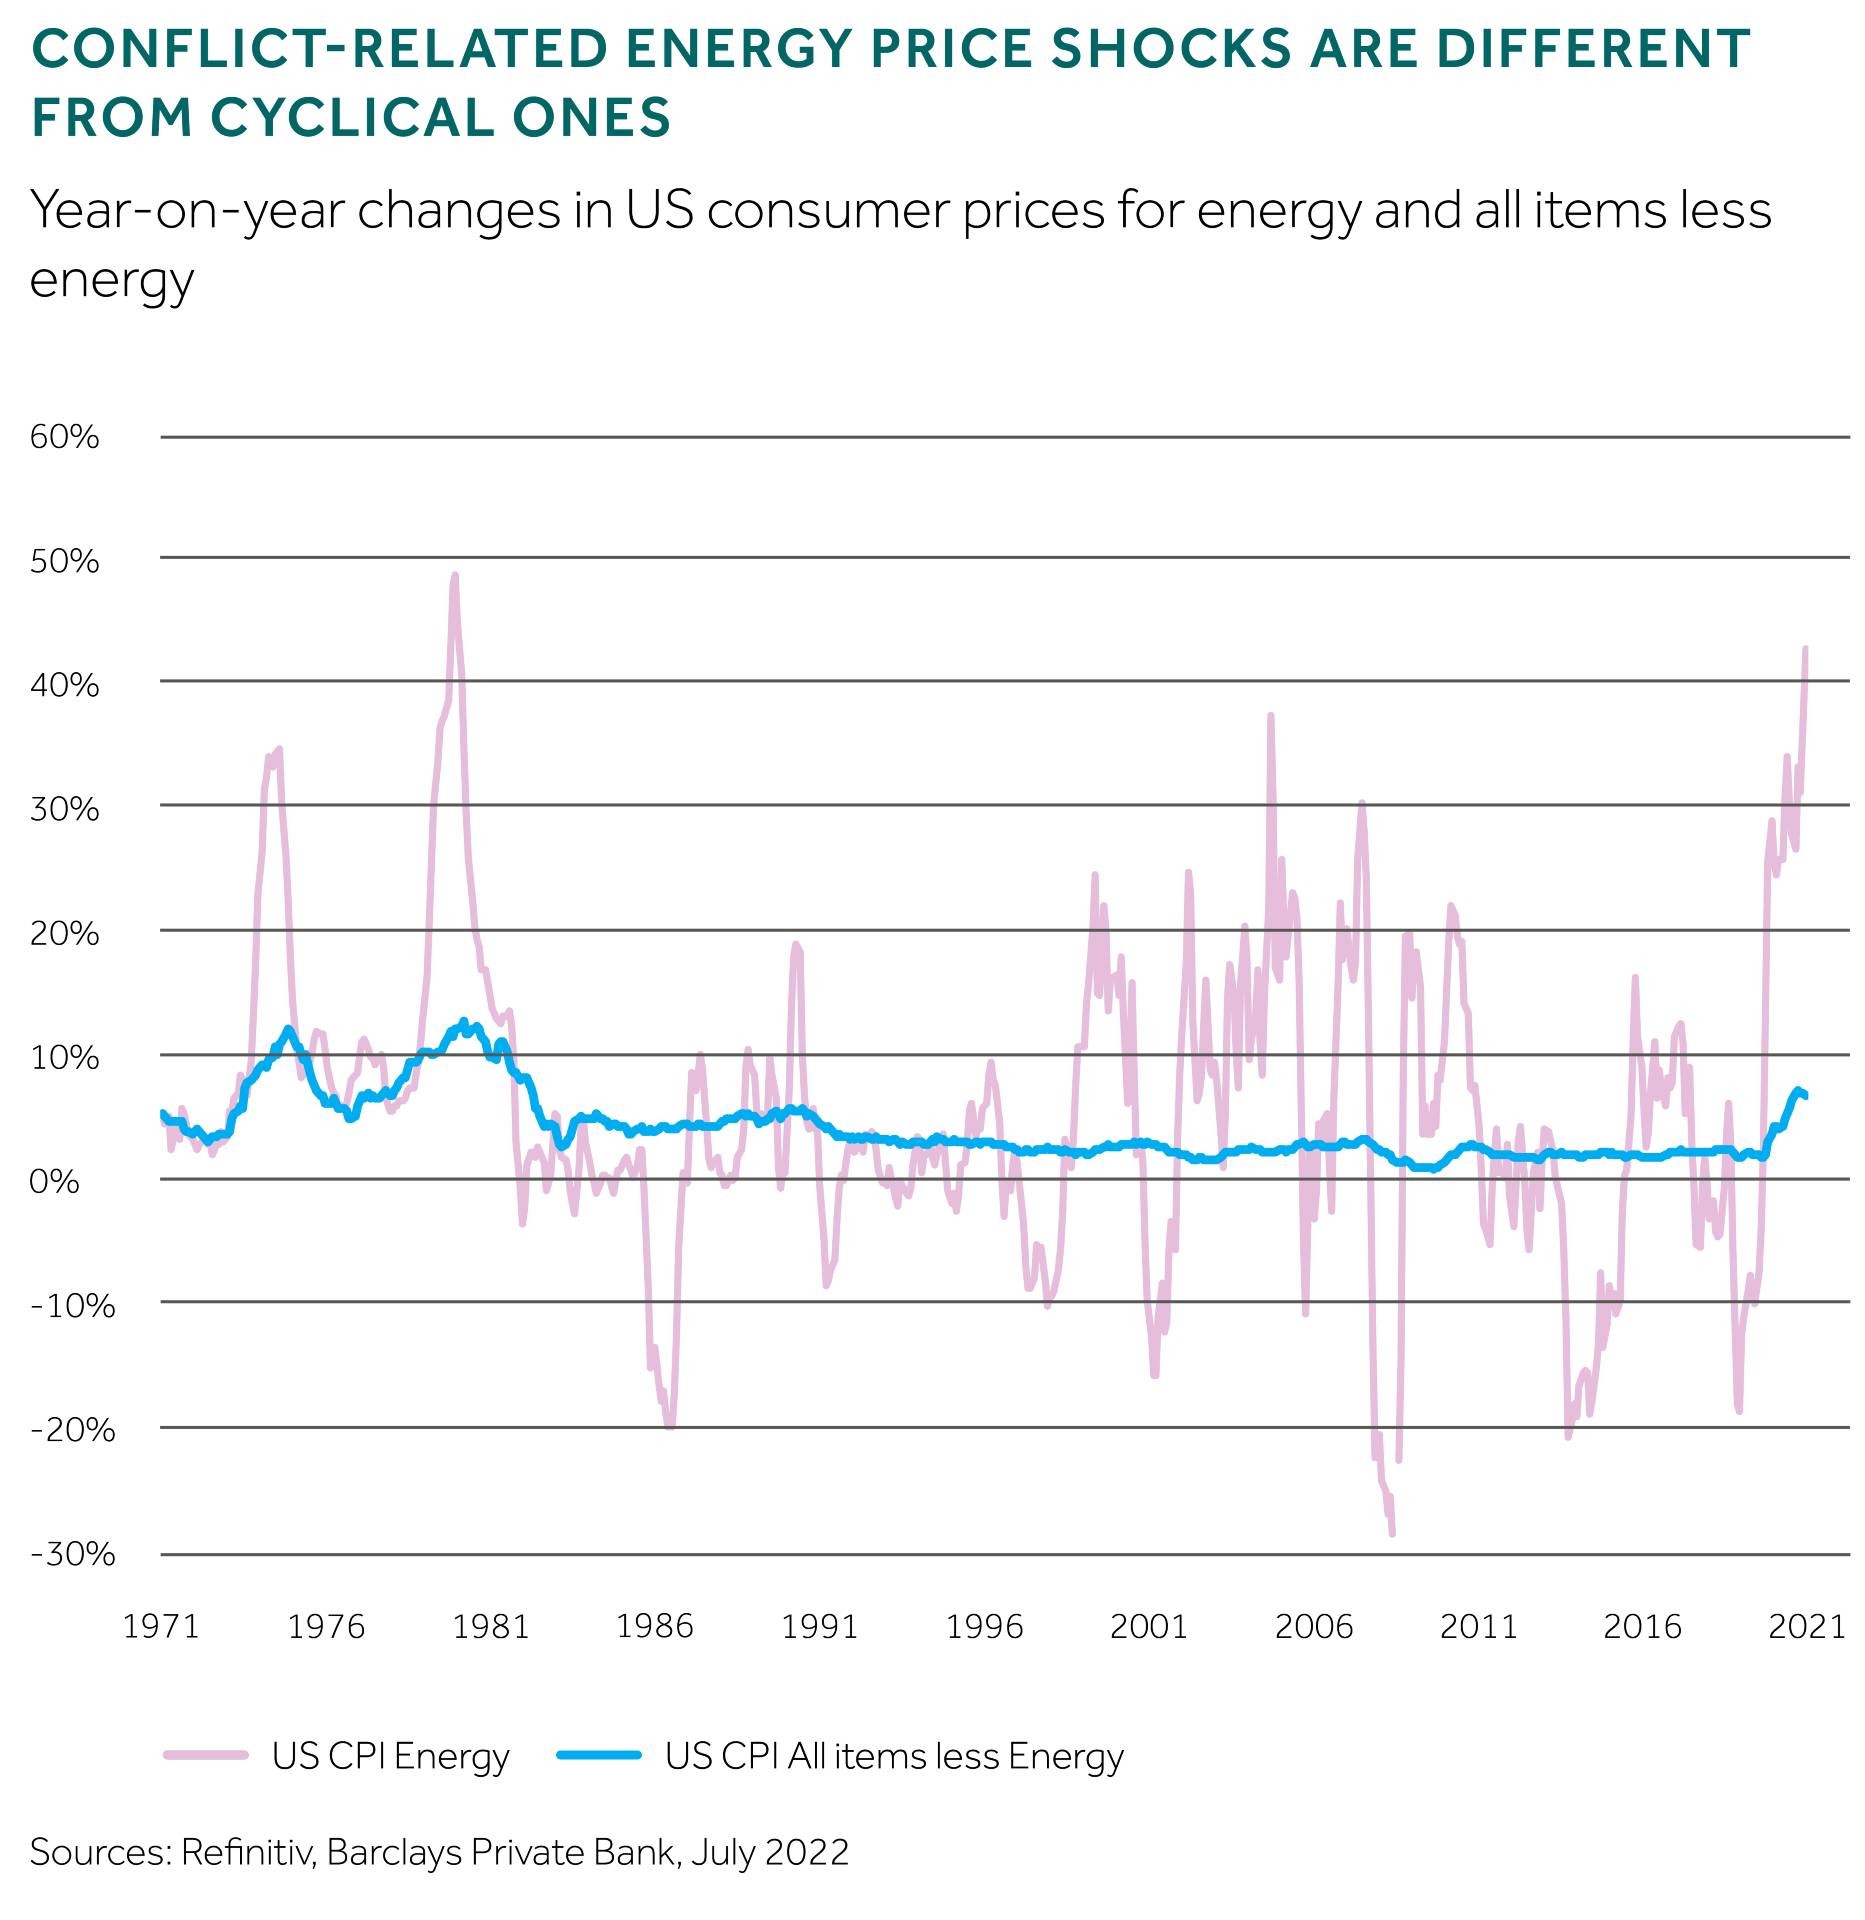
And this is when the conflict in Ukraine led to an increase in the Energy basket of US Consumer prices of 11% in a single month1. Though it came on top of an unusual set of circumstances, an energy-driven price shock borne from conflict events is nothing new. Many things may have changed since the oil shocks of the 1970s2 including CPI baskets, trade effects, energy production, energy-dependence of the economy, interest rate regimes and monetary policy practices. But at its core, such an energy price shock remains a truly exogenous force of (political) nature that cannot be controlled by the tools of fiscal and monetary policy.
Oil shocks behave differently
To understand what the medium-term implications of such a shock on both economics and markets can be, we believe, one has to discard the last 40 years of history and instead go back to the 1970s. The first figure serves as a reminder of the difference of cyclical fluctuations in price indices to the vigour of exogenous, politically-driven oil shocks. We argue that dependencies between goods prices, as well as the steering capabilities of monetary policy, are vastly different during an oil shock. Due to data availability, we limit the analysis to the US economy.

1970s from a macro perspective
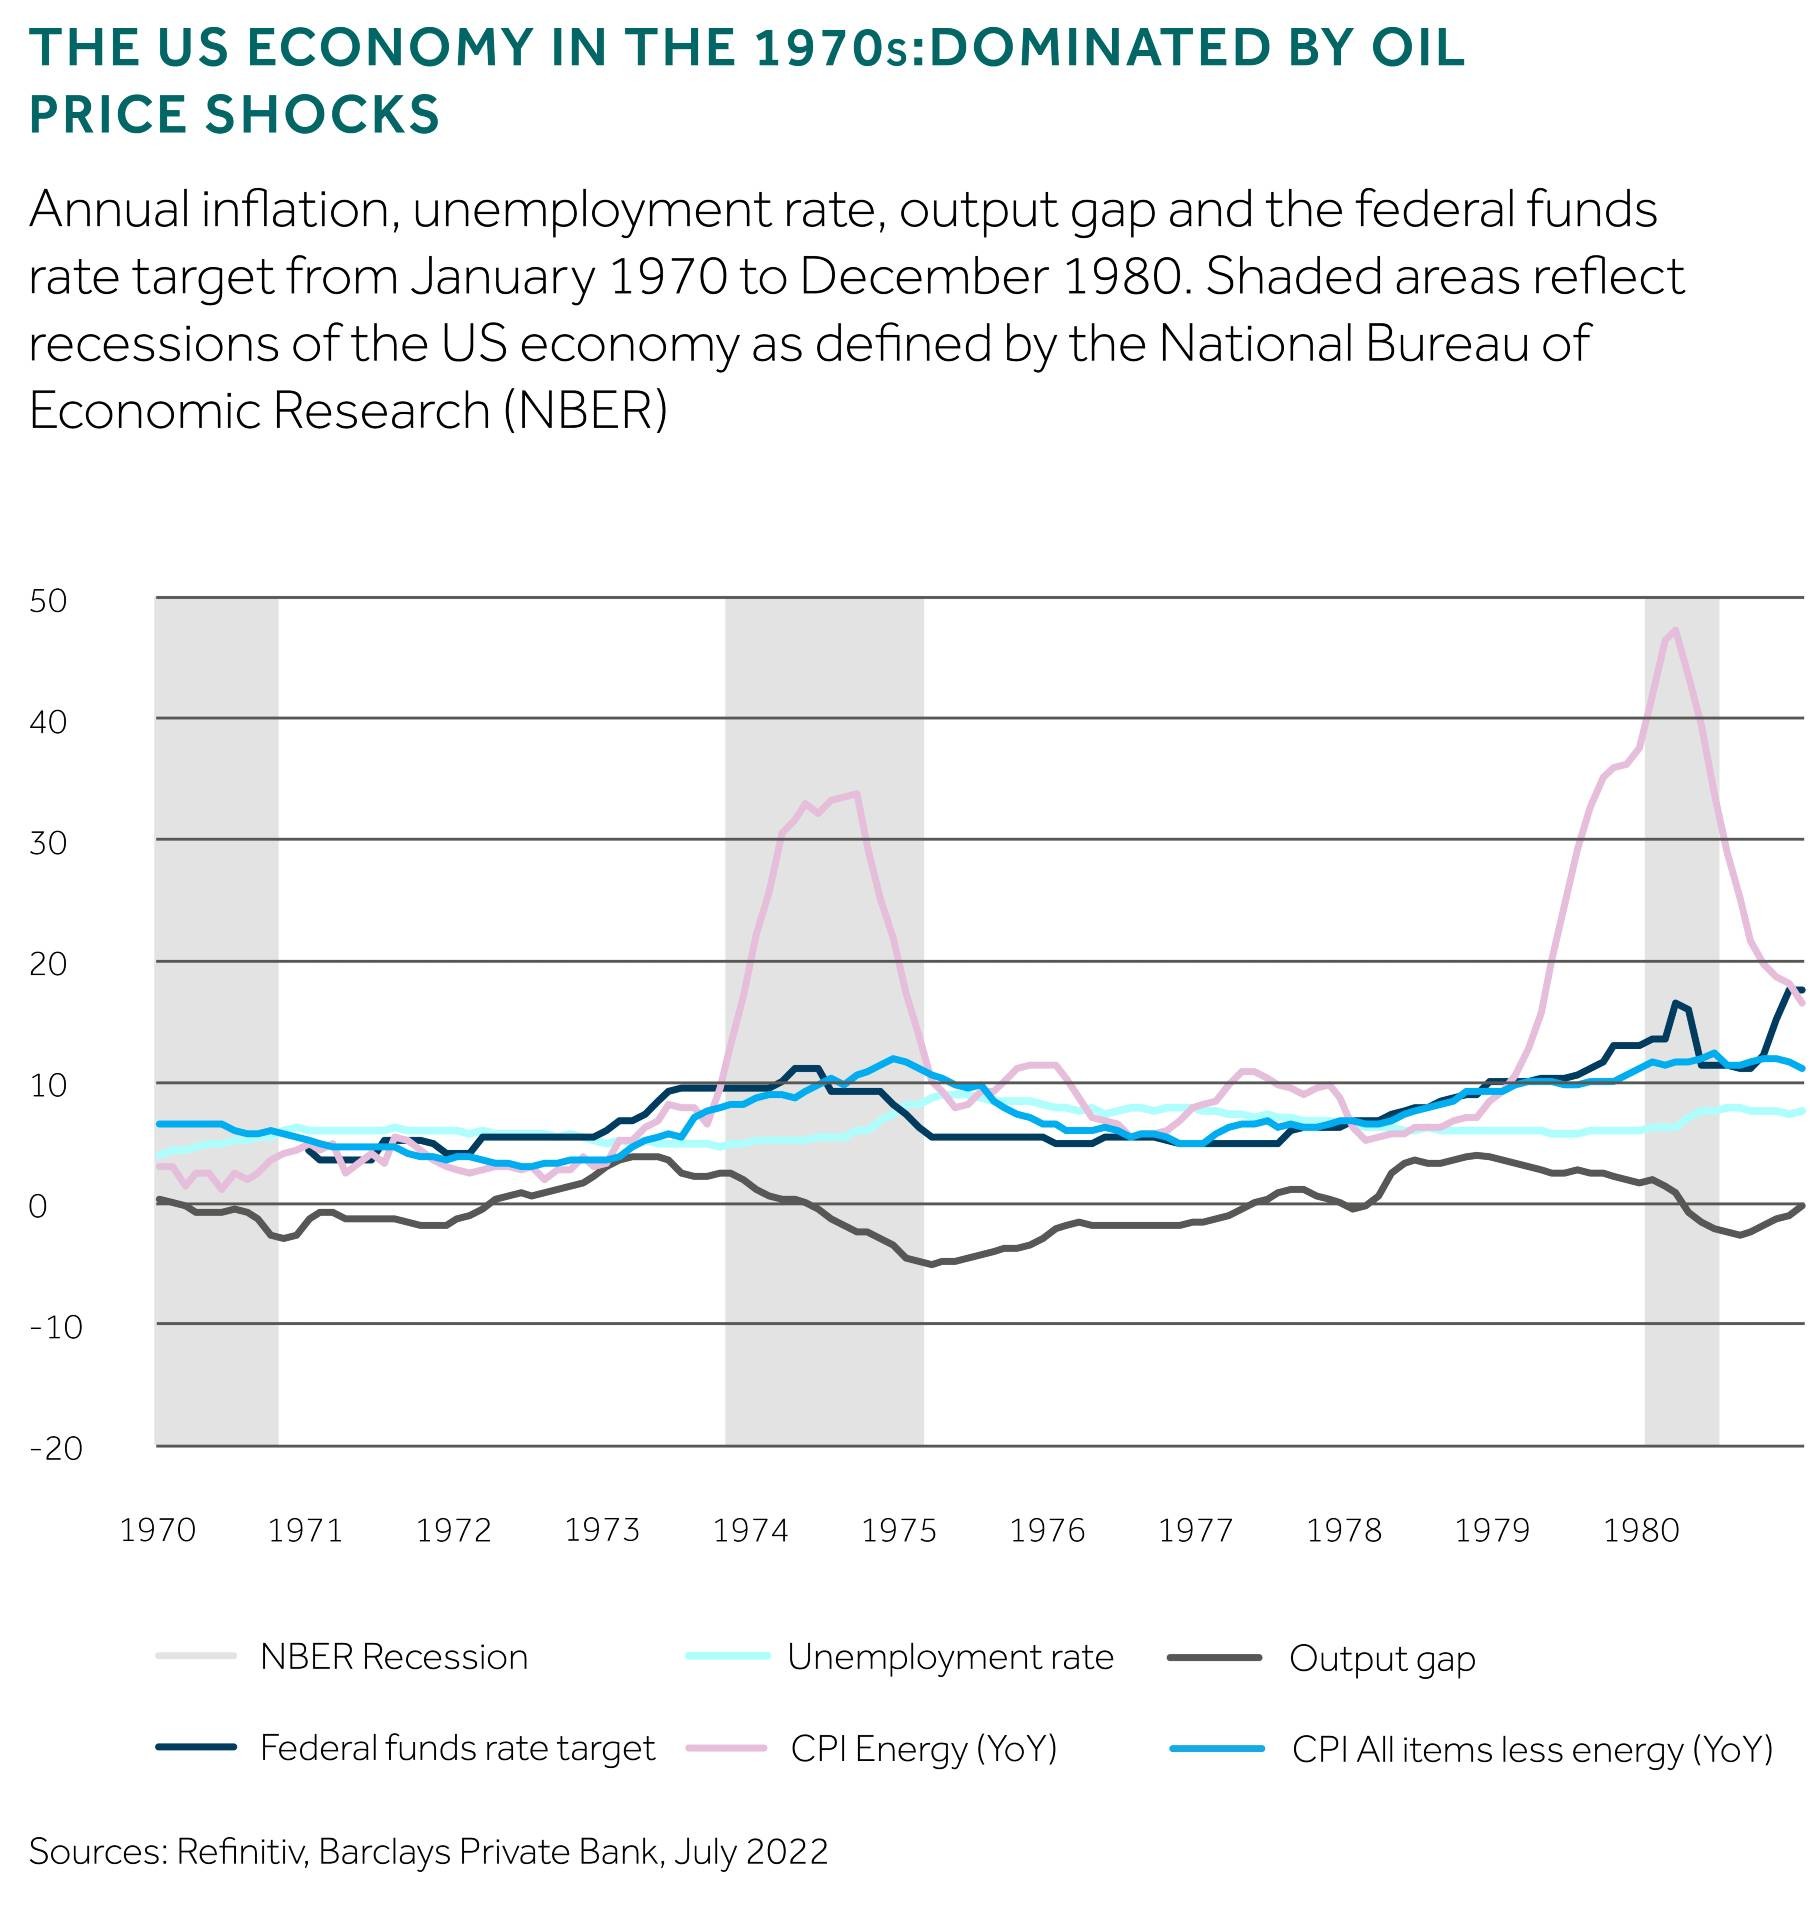
Three things stand out from the graph below which studies the US economy during the 1970s at a very high level:
- First, the energy price surges preceded the goods and services inflation
- Second, interest rate hikes could go along with still accelerating energy price inflation, as long as the economy did not crash into a recession
- Third, it took significantly negative output gaps and strong rises in unemployment to curb the ensuing non-energy inflation
Again, levels such as that of the federal funds rate, the unemployment rate or even the general level of inflation, may have been very different in the 1970s. These cannot be copied one-to-one to today’s situation. But the three findings on the interplay of inflation, monetary policy and growth, we argue, have not changed.

Inflation in the 1970s: reducing the complexity
We could stop at this point, but the 1970s price data harbours more treasure that can be uncovered with a bit of data analysis. We use historical data from the National Bureau of Labor Statistics to group inflation components – not by their category descriptions or names – but by their actual co-movement with each other.
To this end, we feed ten years of 22 monthly price change series into a principal components analysis3. This dimensionality-reduction technique allows us to break down the 22 series to three factors, which explain a bit over 70% of the total variation of all series. Think of this like mapping all data to a new coordinate system that knows only three axes (instead of 22): the first principal component (PC1), the second (PC2), and the third (PC3).
While these new factors are related to all series to some extent, there are dominating so-called loadings that will be shape how we think of them going forward: PC1 explains the largest share of the variation, it is linked to mostly cyclical price changes across all categories, except for fuel. It is most correlated to apparel, vehicles, household goods, and shelter prices. PC2 is strongly positively correlated to fuels, be it motor fuel or heating fuel and negatively correlated to the price for used cars. PC3 is capturing the price dynamics of public services such as public transportation and piped gas while being negatively correlated to food prices. At the risk of overly simplifying, we can call PC1 the broad cyclical factor, PC2 the fuel factor, and PC3 the necessities factor.
Now plotting these principal components against the broad macro variables in the 1970s is instructive as it lets us study the chronological order. Again, PC2 (fuel factor) seems to be a wild card, emerging out of an already receding cycle. PC1 continued its rise past various massive policy rate hikes and it only came to a halt when the economy was already in a recession.

Applying the 1970s learnings to the 2020s
As we believe that interactions between price components are very different in oil shocks as compared to normal cyclical swings, we now take these PCs along with their definitions to the 2020s data – re-imposing the same structure but with data starting from 2020.
Again three observations stick with us: First, the fuel factor leads the cyclical factor considerably. Second, the cyclical factor has not peaked yet. Third, unemployment rates have not budged yet. We leave the output gap uncommented, as it is one of the measures most warped by the COVID-19 shock.

Past performance is not a reliable indicator of future performance. The value of investments can fall as well as rise and you may get back less than you invested.
Thinking ahead: two medium-term scenarios
Inspired by the 1970s, two broad scenarios for the next three to six months emerge: Either the monetary policy tightening is restrictive enough to halt the rise in the cyclical part of the current inflation surge, or it is not and inflation can spiral on even if no longer fuelled by the energy price components.
While we still hold the view that overall inflation in the US will soon peak in the coming months, we acknowledge the growing risk to this view. The excursion to the 1970s has left us with the belief that a serious recession, with significant increases in unemployment rates, may be necessary to smother the raging inflation. Therefore, diversifying a portfolio with regards to not only inflation but also growth and monetary policy, makes sense.
Portfolio diversification with all macro factors in mind
Markets continue to re-assess risks on a daily basis which has led to substantial moves across all asset classes but particularly in commodities. While we believe that a somewhat mild US recession is currently priced in, a more ferocious one would represent a risk to the equity complex as well as cyclical commodities.
In an analysis conducted last year, we summarised the macroeconomic landscape into three broad factors: growth, inflation, and monetary policy4. We then studied the correlations of broad asset classes to each one of these factors while removing the influence of the other two. This analysis allows us to identify hedges for possible macroeconomic risk scenarios.

Past performance is not a reliable indicator of future performance. The value of investments can fall as well as rise and you may get back less than you invested.
Precious metals find a place in portfolios as diversifiers
In a high inflation, low growth and possibly very restrictive monetary policy scenario, only precious metals would have held up well with respect to all three factors. While precious metals were not the strongest hedge to inflation overall, they were the only one that held up when growth suffered – making them a good portfolio diversifier.
This analysis also explains the role of equities, which are often referred to as a hedge against inflation as long as inflation does not become too extreme. That is because during these phases, growth is the dominating factor on investors’ minds. From a hedging perspective, fixed income is interesting in cyclical downswings but also suffers from raging inflation. These simple hedging roles should empower investors to re-think their portfolio allocation with regards to risk scenarios.