
Beware misleading valuation metrics
05 February 2021
Julien Lafargue, CFA, London UK, Head of Equity Strategy
As many equity markets hit record highs, some earnings ratios are flashing red and investors may be hesitant to invest. However, with bond yields still relatively low, there remains good reason to invest in equities for the long term.
Going into this year, the consensus narrative was one of economic recovery, strong earnings growth and continued fiscal and monetary support. While this combination may be a “nirvana” for stock markets, demanding valuations often get in the way, leaving many investors hesitant. While traditional valuation metrics might appear unappealing, their relevance looks limited in the current, low interest rate, environment.
The art of valuation
When valuing a company, investors can use a plethora of metrics based on revenues, profits, cash flows, earnings per share or dividends. Given the large choice available, it is easier to defend either the bull or the base case for investing in the company by picking the ratio that best illustrates the investment rationale.
When it comes to broader indices however, earnings per share is often preferred as the metric is widely available (both on a trailing and forward looking basis), easy to understand and seemingly comparable across sectors and geographies.
Stocks have rarely been more expensive
On a price-to-forward earnings ratio (P/E) basis, the most widely used valuation metric, global equities have rarely appeared richer than they are today. Indeed, the MSCI All Country index trades at around 20 times the earnings expected by the consensus over the next twelve months.
Looking at monthly data from 1988, this level is in the 90th percentile of all observations. In other words, global equities have only been more expensive for 10% of the time in the last 33 years. The same can be said for most local equity indices (see chart). At face value, there seems little incentive for investors to buy into the market at this stage and many prefer to “wait for a better entry point”.
Equity market P/Es
The 12-month forward price-to-earnings figure, and its ranking against available historical data, for world, emerging market, European, US and Chinese equity markets.
| Current 12 month forward P/E* | Percentile** | Starting Date | |
|---|---|---|---|
| MSCI AC World | 20.1 | 90 | 1988 |
| S&P 500 | 22.6 | 95 | 1987 |
| STOXX Europe | 18.0 | 87 | 1999 |
| FTSE-100 | 14.9 | 70 | 1987 |
| MSCI Emerging Markets | 15.9 | 86 | 1998 |
| MSCI China | 16.2 | 92 | 1995 |
* 12-month forward price-to-earnings ratio
** Based on monthly observations since starting date
Sources: Datastream, Barclays Private Bank
The limits of P/E ratios
While P/E ratios globally seem elevated, arguably they offer little insight. Indeed, there appear three main flaws with relying solely on the ratio to inform investment decisions. First, as an aggregate measure encompassing perhaps thousands of constituents, index-level P/Es are influenced by the composition of the market they represent. As such, comparing the ratio across decades fails to account for the significant constituent changes in indices over that time.
As an example of the first flaw, at the end of last year, electric carmaker Tesla joined the S&P 500 with a 2% weighting in the index. Given the company’s market capitalisation and lofty P/E of 370, this addition, all else equal, lifted the index’s P/E by about 0.5 points. The emergence of many large, higher-growth technology companies this century has further distorted historical comparisons, in our opinion.
Seeing the whole picture
Another issue with P/E ratios is that, just like many other valuations metrics, they ignore crucial elements that should be factored in when trying to assess the attractiveness of any investment. These include long-term growth prospects, the cost of capital and the opportunity costs arising from making any investment decision.
The above shortfalls come on top of potential accounting drawbacks associated with reported earnings figures, which sit at the bottom of the profit and loss account and can be subject to many adjustments.
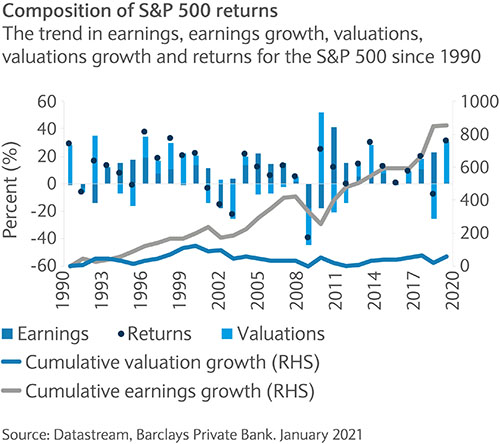
P/E ratios don’t dictate returns
Finally, and maybe most importantly, P/E ratios aren’t usually a good predictor of returns. Valuations are generally mean-reverting and arguably are more likely to contract than to expand from current levels. Yet, this does not necessarily mean that equities are headed for a correction.
Indeed, earnings (and dividends) tend to be a much more important driver of returns. As long as earnings can outgrow the multiple contraction, then investors should experience positive returns (see chart).
Finding value without P/E
Because P/E ratios aren’t reliable valuation tools, especially in the current context of extremely low interest rates, our focus has been on alternative metrics. When it comes to evaluating specific stocks, return on invested capital (ROIC) may be more preferable as it successfully overcomes the effect of capital structure on companies’ performance. In addition, when measured against the weighted average cost of capital (WACC) – which de facto includes the impact of changes in interest rates – ROIC allows investors to assess the business’ ability to generate value for shareholders.
Equities offer value versus bonds
Based on [the ERP], equities remain much more attractive than risk-free bonds and much less expensive than they were in the early 2000s
For broader indices, and because ROIC may be less relevant for certain sectors, the equity risk premium (ERP), or the difference between expected earnings yield (the inverse of the forward P/E ratio) and the yield on risk-free instruments such as Treasuries, may be preferable. In our view, the ERP is most relevant for asset allocators as they are required to choose whether to invest in stocks or bonds.
On the back of the US presidential election and the subsequent Senate runoffs in Georgia, the odds of significantly higher fiscal stimulus have risen. As a result, the yield on 10-year Treasuries has risen steadily, recently breaking above 1%.
The increased Treasuries yield has pushed the ERP below 350 basis points (bp), its lowest level since mid-2018. However, based on this metric, equities remain much more attractive than risk-free bonds and much less expensive than they were in the early 2000s. Back then, the P/E ratio was at a similar level to today but the ERP was -200bp.
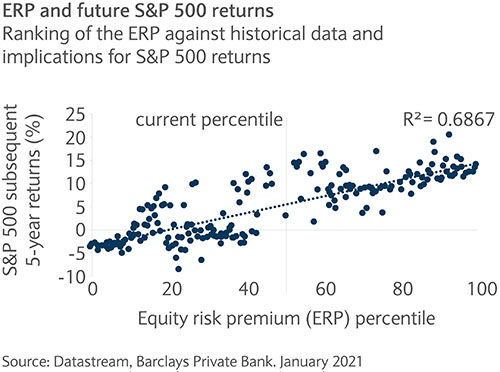
Beware 10-year yields above 1.6%
The ERP is in the middle of its historical range in percentile terms (see chart). This suggests that equities can still generate positive annualised returns over the next five years.
It would be more concerning if the ERP fell below its 40th percentile (see chart). In absolute terms, and all else equal, that equates to a spread of 250bp to 275bp. To achieve that, the US 10-year government bond yield would need to climb above 1.6%, the S&P 500 forward P/E ratio would need to expand to above 25, or a combination of both.
By itself, a 10-year bond yield of 1.6% isn’t necessarily bad for equities. As long as higher rates are the result of more growth, both in economic activity and companies’ profits, equities may still perform well.
Timing is important too, as it usually takes at least a few quarters for earnings growth to emerge. If the 10-year bond yield rises too soon, and too fast ahead of the improvement in earnings, then the ERP would likely contract to dangerous levels.
Staying invested
As the idea of a “reflation” trade…gains traction among investors, we are inclined to slightly increase the cyclicality of equity portfolios
In this context, we think being invested is still the best course of action. As the idea of a “reflation” trade is gaining traction among investors, we are inclined to slightly increase the cyclicality of equity portfolios. However, we would maintain a strong preference for “quality” (or strong ROIC) over any other factor, including what some may refer to as “value”. From a sector’s perspective, this would translate into increased exposure to the industrials complex, moving away from staples and other bond proxies.