
Dispelling the great rates and inflation myth
01 April 2021
By Michel Vernier, CFA, London UK, Head of Fixed Income Strategy
You’ll find a short briefing below. To read an in-depth analysis of this article, please select the ‘full article’ tab.
-
Summary
Key takeaways
- There can be a counter-intuitive relationship between yields and inflation
- With higher inflation expected in the coming months, there are growing concerns over the potential for a more permanent high-inflation environment
- In the bond market, inflation-linked bonds, floating rate bonds and high yield bonds are examples of bond segments that can help to mitigate inflation risk to a certain extent. However, none of the segments is a perfect hedge and additional risk and bond-specific factors should be considered.
The relationship between yields and inflation is not as obvious as it might appear. So what can history tell us about periods of higher inflation and which bond segments might perform best?
The upward trend of long-end yields, which started in August, has accelerated since February. The move is a natural response to the brighter economic outlook and positive news on the vaccine rollout front.
The uncertainty of late has been amplified by the apparent relaxed attitude of the US Federal Reserve to the rate rise and prospects of higher inflation. With higher inflation expected in the coming months, there are growing concerns over the potential for a more permanent high-inflation environment. The last nine spells of higher trending inflation provide some further insights.
Inflation and yield patterns during rising inflation eras Year CPI low CPI peak CPI rate change 10-year yield change during inflation rise 10-year yield change 6m prior to inflation rise Philips curve policy error 1961 0.7% 6.0% 5.3% 3.6% 0.2% End of Bretton Woods 1972 2.9% 12.3% 9.4% 1.0% 0.4% Oil embargo 1976 4.9% 14.8% 9.9% 5.8% -1.1% End of Volcker regime 1986 1.1% 6.3% 5.2% 1.4% -0.1% Phase of high trend growth 1998 1.4% 3.8% 2.4% 0.4% -0.5% Internet bubble recovery 2002 1.1% 3.3% 2.1% -0.4% 0.0% Build-up of housing bubble 2006 1.3% 3.9% 2.6% 1.0% -0.5% Credit crisis recovery 2009 -2.1% 3.9% 6.0% -1.6% 0.6% Trump reflation 2015 0.0% 2.9% 3.0% 1.0% 0.1% Covid V-shape (until today) 2020 0.1% 1.7% 1.6% 1.0% -1.2% While history doesn’t repeat itself and the timeframe does not consider post-war periods, the past 60 years provide many examples of different inflationary environments.
The central bank policy rate is another influential factor for the long end of the curve, given the shape of the curve reflects the market’s expectation for future policy rates. Here, the often-quoted yield curve steepness provides some insights.
Since 1962 this difference peaked at around 370 basis points (bp) on three occasions 1992 / 2002 / 2009 while most of the times 290bp represented the maximum point. The sharp steepening during the three aforementioned periods, as much as during most periods, was entirely induced by policy rate cuts, and (contrary to common believe) not by higher trending rates (see chart).
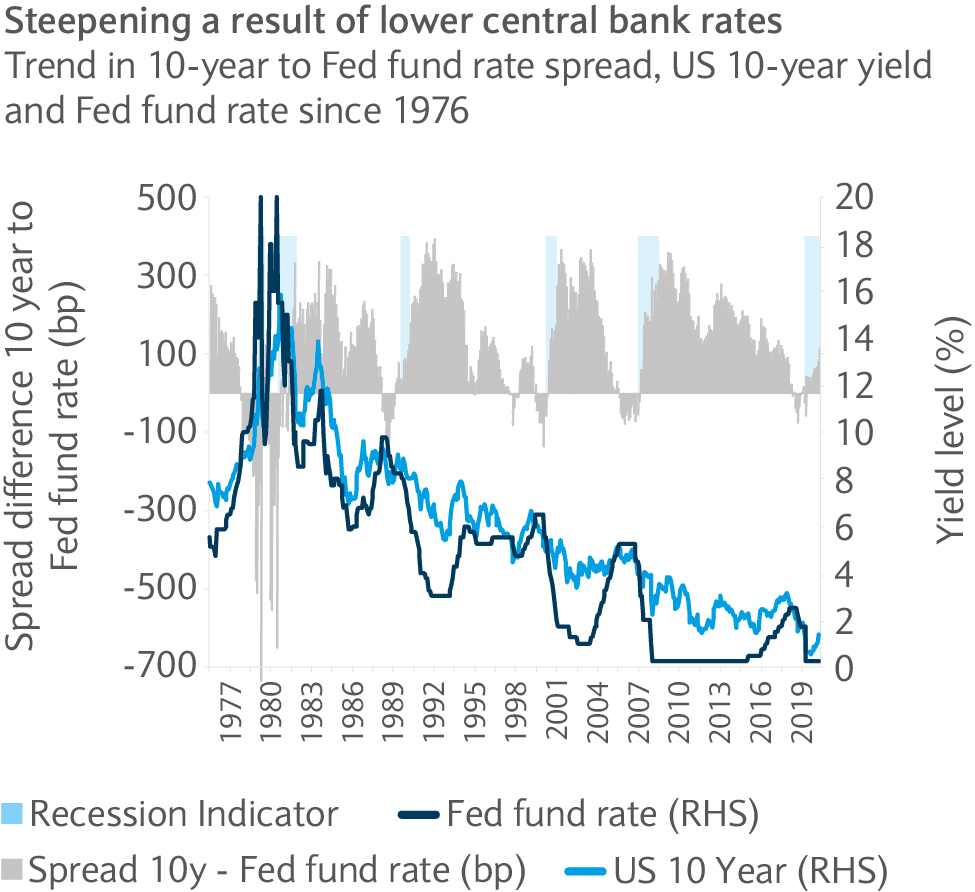
While a steepening to 370bp as seen in the past cannot be ruled out this time, it becomes clear that by applying the historical pattern, while ignoring the common cause for steepening, may lead to false conclusions. So, how can previous patterns best be applied to the current situation?
Admittedly, the Fed is seemingly less concerned about the long end of the curve at this stage, this may lead to further spikes beyond what may seem justified. In a scenario of an unexpected elevated and persistent inflation, it seems more likely that the Fed may change its course and start the hiking cycle earlier, and by more than anticipated.
Within the bond market inflation-linked bonds, floating rate bonds and high yield bonds can all help to mitigate inflation risk to a certain extent.
Inflation-linked bonds may seem a first choice to reduce potential inflation risk for many investors – but inflation protection comes at a cost, as inflation-linked bonds usually offer a substantially lower yields impacted by the change in real yields during the respective bond’s lifetime.
This yield disadvantage, compared with nominal bonds, is shown in the breakeven yield (implied inflation expectation). In the US, the breakeven inflation yield stands at 2.3%. This means that only if inflation averages above 2.3% or more over the 10-year time horizon will the investment in the respective inflation-linked bonds trump that of the respective nominal bond alternative.
Floating rate bonds, which are linked to a short-term rate index are another option to mitigate inflation risk. This is because coupons traditionally trended up with higher trending inflation.
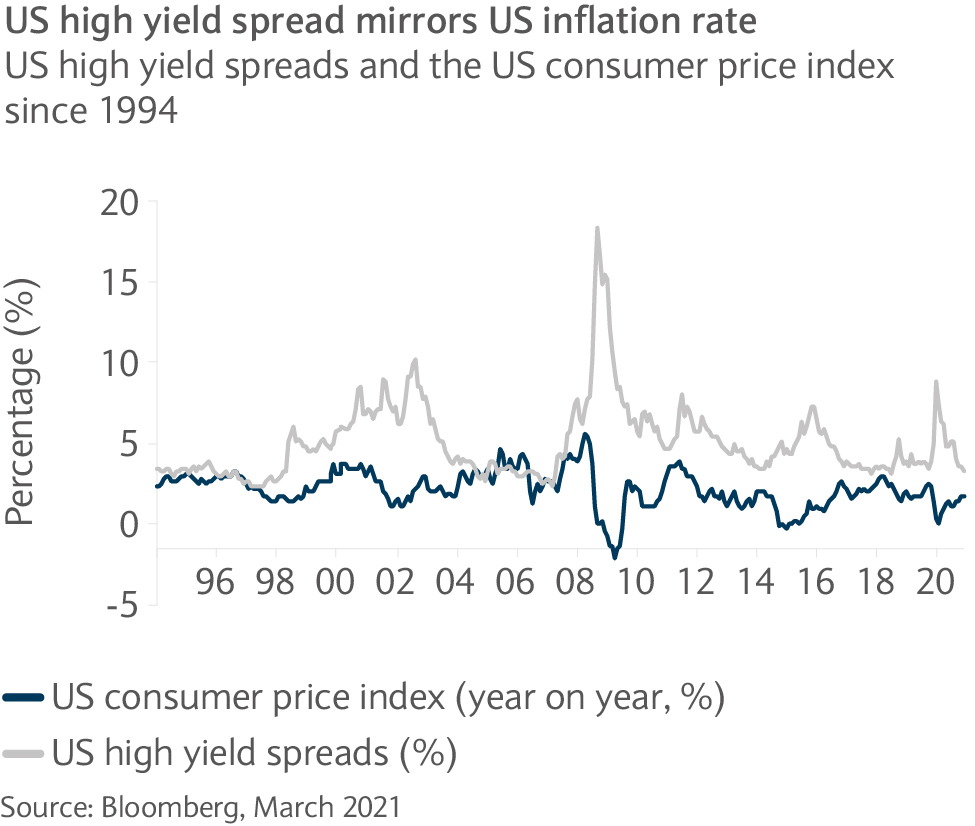
High yield bonds appear to be an effective hedge against “good inflation” at least. Brighter economic prospects usually lift inflation expectations and at the same time lead to spread compression within high yield bonds. Spreads mirror inflation well, suggesting that high yield bonds are a good way to protect against higher inflation. Excessive inflation can equally be detrimental so a cautious approach may well be the wisest.
-
Full article
The relationship between yields and inflation is not as obvious as it might appear. At the same time yields often follow central bank messaging but can also deviate substantially. What does history tell us about periods of higher inflation and which bond segments might perform best at such times?
The upward trend of long-end yields, which started in August, has accelerated since February. The move is a natural response to the brighter economic outlook and positive news on the vaccine rollout front, hinting at an inflationary recovery as seen during many post-crisis periods. In addition, uncertainty seems remarkably high, partly expressed by rising real yields (or yields adjusted for expected inflation) and in the elevated implied-rate volatility levels.
Fed is not helping
The uncertainty of late has been amplified by the apparent relaxed attitude of the US Federal Reserve (Fed) to the rate rise and prospects of higher inflation.
Fed governor Jerome Powell had a sobering message during March’s Federal Open Market Committee meeting for investors, who expected a stronger commitment from the Fed to tame yields: “The fundamental change in our framework is that we’re not going to act pre-emptively based on forecasts, for the most part, and we’re going to wait to see actual data. I think it will take people time to adjust to that, and the only way we can really build the credibility of that is by doing that.”
With this the rate market seems torn between higher inflation and uncertainties in the early stage of the recovery.
With higher inflation expected in the coming months, concerns over a more permanent environment of high- inflation grow. Surprisingly, the historical relationship between rates and inflation does not always support the traditional framework: higher inflation leading to higher yields. The last nine spells of higher trending inflation (see table) provide some further insights.
Inflation and yield patterns during rising inflation eras Year CPI low CPI peak CPI rate change 10-year yield change during inflation rise 10-year yield change 6m prior to inflation rise Philips curve policy error 1961 0.7% 6.0% 5.3% 3.6% 0.2% End of Bretton Woods 1972 2.9% 12.3% 9.4% 1.0% 0.4% Oil embargo 1976 4.9% 14.8% 9.9% 5.8% -1.1% End of Volcker regime 1986 1.1% 6.3% 5.2% 1.4% -0.1% Phase of high trend growth 1998 1.4% 3.8% 2.4% 0.4% -0.5% Internet bubble recovery 2002 1.1% 3.3% 2.1% -0.4% 0.0% Build-up of housing bubble 2006 1.3% 3.9% 2.6% 1.0% -0.5% Credit crisis recovery 2009 -2.1% 3.9% 6.0% -1.6% 0.6% Trump reflation 2015 0.0% 2.9% 3.0% 1.0% 0.1% Covid V-shape (until today) 2020 0.1% 1.7% 1.6% 1.0% -1.2% Back to the future?
While history doesn’t repeat itself and the timeframe does not consider post-war periods, the past 60 years provide many examples of different inflationary environments.
The first three periods of higher trending inflation can arguably be summarised as the era of great inflation. The era was caused by a multitude of factors, like a lack of understanding about the interaction between unemployment and inflation (so-called Philips curve), the end of the Bretton Woods (gold standard) system and external factors, like excessive oil price increases (oil embargo).
The periods thereafter were caused by asset bubbles, high trend growth, reflation policy and various other factors. What is notable from a bond investor perspective, is the rather loose relationship between the degree of inflation and the shift in long-end bond yields.
While rates moved up substantially in sympathy with inflation from 1976, yields barely mirrored its change in 1972. It could be argued that rates may have already anticipated higher inflation prior to the inflation realisation phase. But quite the opposite seemed to be the case, as on five occasions yields did not seem to anticipate the turning point of inflation.
Long-end yields rarely mirrored inflation rates
The often muted reaction in yields confirms the view that yields are ultimately driven by many factors, such as trend growth, central bank policy, supply and demand, investor preferences or the regulatory environment. It also shows that inflation, if caused by external input factors, can also dampen the growth outlook, which in turn may lead to lower yields rather than higher ones.
Policy rates leading the way
The central bank policy rate is another influential factor for the long end of the curve, given the shape of the curve reflects the market’s expectation for future policy rates. Here, the often quoted yield curve steepness provides some insights. Re-occurring patterns and mean reversion observed in the yield curve steepness over time may help to assess the current situation.
While steepness can be measured at various points on the curve (say 10-year versus two-year yields, or versus 3-month or 30-year yields versus five-year yields) the chart simply looks at the difference between the 10 year and the Fed’s policy rate.
Since 1962 this difference peaked at around 370 basis points (bp) on three occasions 1992 / 2002 / 2009 while most of the times 290bp represented the maximum point. The sharp steepening during the three aforementioned periods, as much as during most periods, was entirely induced by policy rate cuts, and (contrary to common believe) not by higher trending rates.
Long end rarely causes steepening
While a steepening to 370bp as seen in the past cannot be ruled out this time, it becomes clear that by applying the historical pattern while ignoring the common cause for steepening may lead to false conclusions. In fact, the often quoted 1970/1980 period showed that elevated inflation caused the Fed to act while the long end only followed, leading to a deeply inverted curve on both occasions, not a steepening curve.
How can previous patterns best be applied to the current situation? The curve’s steepness is currently around 170bp, of which 50bp was induced by Fed rate cuts and 120bp was caused by the rise at the long end. Historically, rising rates at the longer end of the curve led to a maximum of 180bp additional steepening in 2008 while in 2013 it was 130bp and in 2016 it was 120bp.
The above illustrates that there is a limit to what extent the long end differs from the prevailing Fed policy rate. Given the central bank’s commitment to keep rates unchanged through to 2023, the scope for further steepening appears limited.
Rate volatility unlikely to disappear
Admittedly, with the Fed seemingly less concerned about the long end of the curve at this stage, this may lead to further spikes beyond what may seem justified, considering the expectation of a gradual rise in inflation but not an excessive one. As outlined above, the rule that higher inflation leads to a steeper curve, which in turn is caused by higher yields at the long end, can safely be challenged given historical patterns.
In a scenario of an unexpected elevated and persistent inflation, it seems more likely that the Fed may change its course (not the first time) and start the hiking cycle earlier, and by more, than anticipated. This would lead to higher trending rates at the short end but not at the longer end (or flattening). While this is a possibility, it seems less likely for now in our view.
Bond segments: mitigating inflation risk
Within the bond market inflation-linked bonds, floating rate bonds and high yield bonds are examples of bond segments that can help to mitigate inflation risk to a certain extent. However, none of the segments is a perfect hedge and additional risk and bond-specific factors should be considered.
Inflation-linked bonds: the almost perfect hedge Inflation-linked bonds seem a first choice to reduce potential inflation risk within bond portfolios for many investors, given that the value of the respective bonds increases in line with the respective inflation index (CPI – consumer price index / RPI – retail price index). As such, the risk of excessive inflation is supposedly eliminated.
Inflation protection comes at a cost, as inflation-linked bonds usually offer a substantial lower yield (currently mostly negative). This yield disadvantage, compared with nominal bonds, is shown in the breakeven yield (implied inflation expectation). In the US, the breakeven inflation yield stands at 2.3%. This means that only if inflation averages above 2.3% or more over the 10-year time horizon will the investment in the respective inflation-linked bonds trump that of the respective nominal bond alternative (see chart).
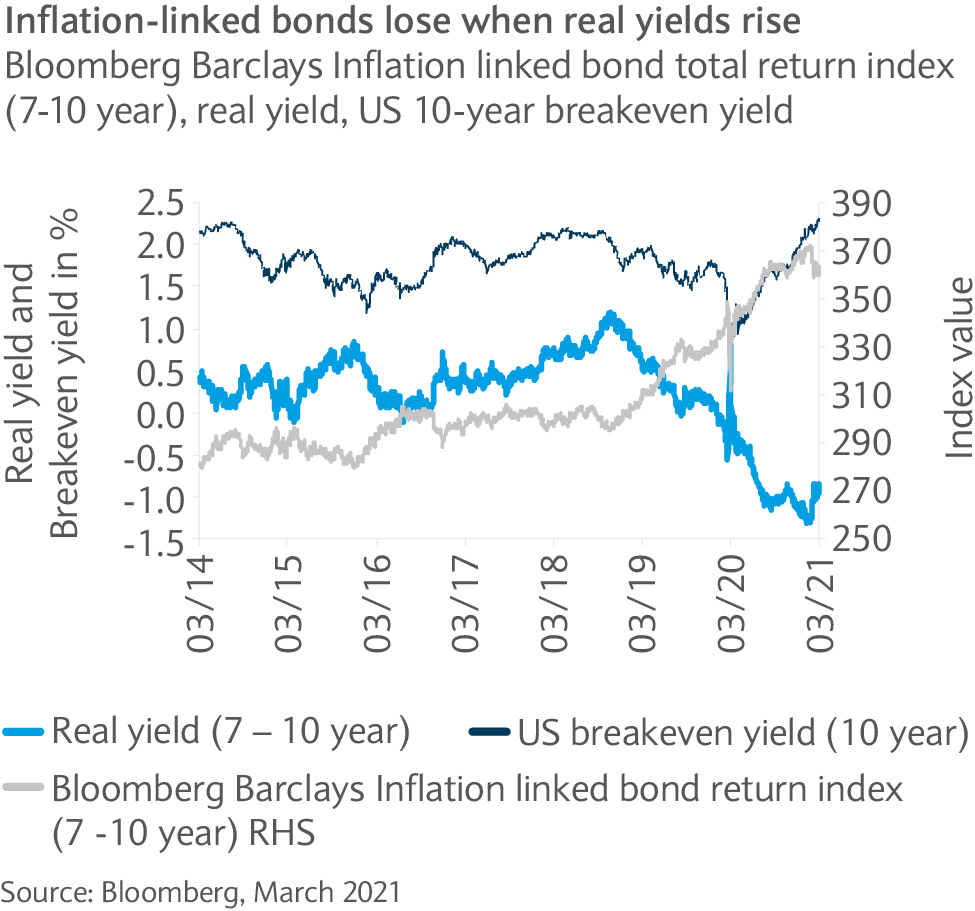
While the above is true from a pure buy-and-hold perspective, the market value of the inflation-linked bonds is impacted by the change in real yields during the respective bond’s lifetime. A rise in real yields would lead to a decline in value, even if inflation expectations stay unchanged or increase.
This situation was witnessed in February, when rising real rates led to a decline in inflation-linked bond indices, while breakeven rates continued their upward trend. While inflation-linked bonds can help to mitigate the inflation risk, real rates and breakeven rates are important when assessing their attractiveness.
Floating rates a less obvious choice now
Floating rate bonds which are linked to a short-term rate index have long been another option to mitigate inflation risk. This is because coupons traditionally trended up with higher trending inflation given the high sensitivity of short-term rates to inflation. That said, floating-rate bonds seem a less obvious choice now given the depressed yields and the Fed’s commitment to keep yields low for an extended period.
The dark horse: high yield bonds
High yield bonds appear to be an effective hedge against “good inflation” at least. Brighter economic prospects usually lift inflation expectations and at the same time lead to spread compression within high yield bonds given that high yield issuers are disproportionally reliant on a constructive economic backdrop. Spreads mirror inflation (negative correlation) well (see chart), suggesting that high yield bonds are a good way to protect against higher inflation. However, spreads and lower trending defaults do not always go hand in hand with higher trending inflation. Excessive inflation can equally be detrimental.
Related articles
Investments can fall as well as rise in value. Your capital or the income generated from your investment may be at risk.
This communication:
- Has been prepared by Barclays Private Bank and is provided for information purposes only
- Is not research nor a product of the Barclays Research department. Any views expressed in this communication may differ from those of the Barclays Research department
- All opinions and estimates are given as of the date of this communication and are subject to change. Barclays Private Bank is not obliged to inform recipients of this communication of any change to such opinions or estimates
- Is general in nature and does not take into account any specific investment objectives, financial situation or particular needs of any particular person
- Does not constitute an offer, an invitation or a recommendation to enter into any product or service and does not constitute investment advice, solicitation to buy or sell securities and/or a personal recommendation. Any entry into any product or service requires Barclays’ subsequent formal agreement which will be subject to internal approvals and execution of binding documents
- Is confidential and is for the benefit of the recipient. No part of it may be reproduced, distributed or transmitted without the prior written permission of Barclays Private Bank
- Has not been reviewed or approved by any regulatory authority.
Any past or simulated past performance including back-testing, modelling or scenario analysis, or future projections contained in this communication is no indication as to future performance. No representation is made as to the accuracy of the assumptions made in this communication, or completeness of, any modelling, scenario analysis or back-testing. The value of any investment may also fluctuate as a result of market changes.
Barclays is a full service bank. In the normal course of offering products and services, Barclays may act in several capacities and simultaneously, giving rise to potential conflicts of interest which may impact the performance of the products.
Where information in this communication has been obtained from third party sources, we believe those sources to be reliable but we do not guarantee the information’s accuracy and you should note that it may be incomplete or condensed.
Neither Barclays nor any of its directors, officers, employees, representatives or agents, accepts any liability whatsoever for any direct, indirect or consequential losses (in contract, tort or otherwise) arising from the use of this communication or its contents or reliance on the information contained herein, except to the extent this would be prohibited by law or regulation. Law or regulation in certain countries may restrict the manner of distribution of this communication and the availability of the products and services, and persons who come into possession of this publication are required to inform themselves of and observe such restrictions.
You have sole responsibility for the management of your tax and legal affairs including making any applicable filings and payments and complying with any applicable laws and regulations. We have not and will not provide you with tax or legal advice and recommend that you obtain independent tax and legal advice tailored to your individual circumstances.
THIS COMMUNICATION IS PROVIDED FOR INFORMATION PURPOSES ONLY AND IS SUBJECT TO CHANGE. IT IS INDICATIVE ONLY AND IS NOT BINDING.