
The brightest binary star in the investment universe
01 April 2021
By Nikola Vasiljevic, Zurich, Switzerland, Head of Quantitative Strategy
You’ll find a short briefing below. To read an in-depth analysis of this article, please select the ‘full article’ tab.
-
Summary
Key takeaways
- Investors now have a much wider range of investment options to choose from
- Equities are the key driving force of the wealth creation process
- Equities and government bonds lie at the heart of most portfolios, but, in a post-pandemic world, some of the historical relationships between asset classes might be tested. At such times, a multi-asset class approach has its attractions.
The investment universe has grown immensely, and investors can now choose between cash, developed government and investment grade bonds, high yield and emerging market bonds, equities, commodities, real estate, hedge funds, foreign exchange and private markets, as well as derivatives and other less conventional asset classes.
Despite the growing complexity, equities and bonds usually remain at the heart of any investment portfolio.
In addition to the growth potential, equities provide a source of income. For much of the 20th century, dividends were the dominant channel for cash redistribution to shareholders.
However, during the 1980s, companies’ propensity to repurchase shares increased significantly while dividend payments decreased over time.
Equities still represent the key driving force of the wealth creation process. Income, growth and valuation components compound over time and reward patient investors in the long run as the chart below explains.
Investors who look beyond short-term market fluctuations and remain invested are likely to harvest a material equity risk premium over the long haul.
Despite the strong long-term performance of equities, it can be difficult to remain calm in times of stock market crashes. Often, many investors can simultaneously attempt to exit their positions within a short period of time, which exacerbates price swings and their potential losses.
Our analysis shows that selling equities immediately after a market crash and staying on the sidelines for the next one to six months is suboptimal compared to the strategy of being invested the whole time.
Government bonds have been a natural candidate as diversifiers in a portfolio. Investors in Treasuries benefit from a stable income stream and high likelihood of repayment of their initial investment.
The steady income and low volatility potential of government bonds, as well as their historical negative correlation with US equities, support their appeal for inclusion in a multi-asset portfolio.
-
Full article
Equities and bonds represent the two brightest stars in the investment universe, possessing unique and distinct investment characteristics. They can jointly form a core binary system around which other asset classes orbit.
The investment universe has grown immensely over the last three decades. Among assets available, investors can now choose between cash, developed government and investment grade bonds, high yield and emerging market bonds, equities, commodities, real estate, hedge funds, foreign exchange and private markets. If we include derivatives and some less conventional asset classes, the investment opportunity set can be greatly inflated.
Despite the growing complexity, equities and bonds usually remain at the heart of any investment portfolio. In this article we examine their roles from a strategic asset allocation (SAA) perspective.
Equities as growth drivers
Equities offer one of the greatest growth prospects among all asset classes. Generally, corporate growth is generated by investing retained earnings or new capital into profitable business projects.
In the long run, the aggregate earnings growth is inextricably linked with the economic growth. During economic booms and busts, investors’ behavioural biases and irrational exuberance often lead to strong market overreactions.
However, diverging trends between the economic and corporate earnings growth tends to have a finite life. Moreover, the long-term aggregate earnings and economic growth are ultimately bounded by the rate of technological progress and the growth of input factors.
Dividends and buybacks
In addition to the growth potential, equities provide a source of income. For much of the last century, dividends were the dominant channel for cash redistribution to shareholders.
Following regulatory and tax changes in the US during 1980s, companies’ propensity to repurchase shares increased significantly. In turn, the average dividend payments decreased over time.
Although associated with the US initially, the substitution of dividends with share buybacks has gained traction in much of the world. Currently, the total income return is about 2-4% in developed markets.
Valuation matters
The valuation pillar of equity returns captures the changes in the price/earnings (P/E) ratio, which represents the price that investors are willing to pay per unit of a company’s earnings. Due to its tendency to mean revert, many market practitioners use P/E ratios as an indicator of future returns. Historically low (high) values of the ratio are typically interpreted as a sign of high (low) future returns.
There are many definitions of the P/E ratio. The cyclically adjusted price-earnings (CAPE) ratio, which smooths out the cyclical swings in corporate earnings and accounts for the impact of inflation, is one that is commonly used. It can provide better forecasts of stock returns over longer investment horizons to other valuation methods.
In the short term, changes in P/E ratios are primarily driven by investor sentiment. The key long-term factors are the risk-free rate and the 10-year bond yield (or alternatively the term premium), inflation and its volatility as well as changes in the dividend payout policy. For broad equity indices, the sectoral composition can substantially change. Such shifts may create significant structural bias.
Equities for the long run
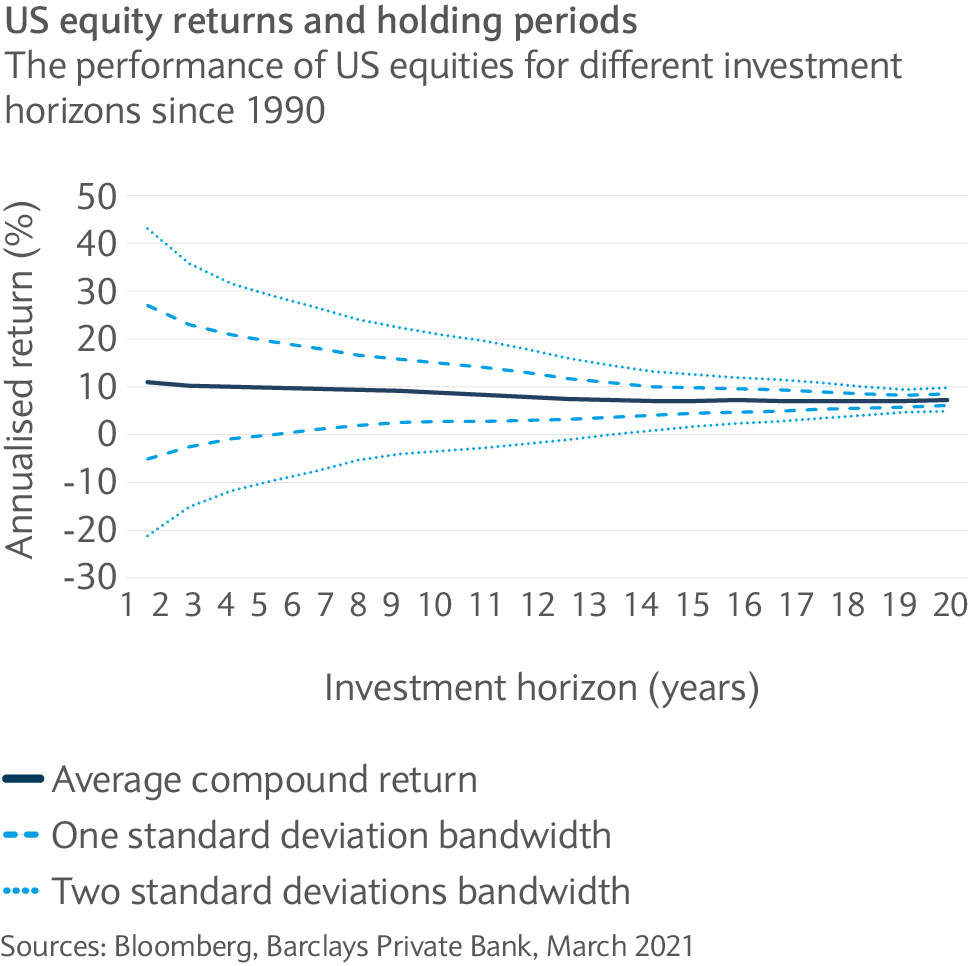
Equities represent the key driving force of the wealth creation process. Income, growth and valuation components compound over time and reward patient investors in the long run.
For a one-year holding period, the range of US equity returns is extremely wide (two standard deviations bounds span the interval from -20% to 40%, with an average of about 11%). With increasing investment horizons, the likelihood of negative returns steadily decreases.
Since January 1990, US equities have posted only positive returns for holding periods longer than 12 years. Over the longest holding period considered in our example (20 years), the average compound return is approximately 6% (see chart).
Investors that are able to look beyond short-term market fluctuations and remain invested are likely to harvest a material equity risk premium over the long haul.
Fighting the loss aversion
Despite the strong long-term performance of equities, it can be difficult to remain calm in times of stock market crashes. Often, many investors can simultaneously attempt to exit their positions within a short period of time, which exacerbates price swings and their potential losses.
Moreover, the elevated risk and uncertainty may discourage them from quickly re-entering equities and profiting from the market recovery.
To investigate the impact of investors’ withdrawal from equities after a sell-off, we consider the relative performance of staying-invested versus exiting-the-market strategies over six-month holding periods following the ten worst monthly drawdowns for US equities over the past 30 years. This corresponds to seven distinct crises periods (see table).
Market Stock Date Initial Shock Performance: Staying Invested (SI) vs. exiting market (EM) 1M 2M 3M 4M 5M 6M The 1990 oil price shock Aug 1990 -9.2 -5.8 -6.2 1.2 4.2 9.2 16.0 The 1998 Russian financial crisis Aug 1998 -13.9 8.1 16.9 24.2 30.2 34.3 31.5 The Dot-com bubble Feb 2001 -9.0 -6.3 0.8 1.3 -0.8 -1.7 -8.4 Stock market downturn of 2002 Sep 2002 -11.3 8.7 14.1 8.2 5.8 4.2 5.1 The global financial crisis Sep 2008 -9.2 -14.3 -21.1 -20.0 -28.0 -39.2 -30.7 Oct 2008 -17.1 -7.4 -6.2 -14.9 -27.2 -17.9 -8.4 Feb 2009 -10.3 10.9 22.1 28.2 28.4 36.1 39.5 Stock market correction of 2018 Dec 2018 -9.1 9.0 12.4 14.3 18.3 11.5 18.4 2020 Stock market crash (COVID-19) Feb 2020 -8.2 -17.6 -1.6 4.4 6.9 13.3 20.7 Mar 2020 -12.7 15.4 21.2 23.6 29.7 36.9 33.1 Count (SI > EM) 5 6 8 7 7 7 Average Return 0.1 5.2 7.0 6.7 8.7 11.7 Median Return 1.2 6.6 6.3 6.4 8.7 17.2 Standard Deviation 11.7 14.3 16.2 21.4 24.4 22.2 Maximum Return 15.4 22.1 28.2 30.2 36.9 39.5 Minimum Return -17.6 -21.1 -20.0 -28.0 -39.2 -30.7 Our analysis shows that selling equities immediately after a market crash and staying on the sidelines for the next one to six months is suboptimal compared to the strategy of being invested the whole time. Even over a one-month period, exiting the market is not a clear winner. The wait- and-see approach over two to six months, following the ten largest US equity drawdowns since 1990, resulted in 5-11% relative underperformance on average.
Even from a tactical perspective during the periods of worst equity performance and highest uncertainty, the above suggests that it pays to remain invested. The global financial crisis of 2008 is a reminder that for every rule there is an exception. Our results hold only on average, and they merely illustrate that running away from markets in typically a suboptimal decision.
Government bonds to the rescue
Despite the appeal of equities, in reality the full-speed, risk-on approach can be suboptimal for many investors due to their high risk and loss aversion attitudes, specific investment goals and financial needs.
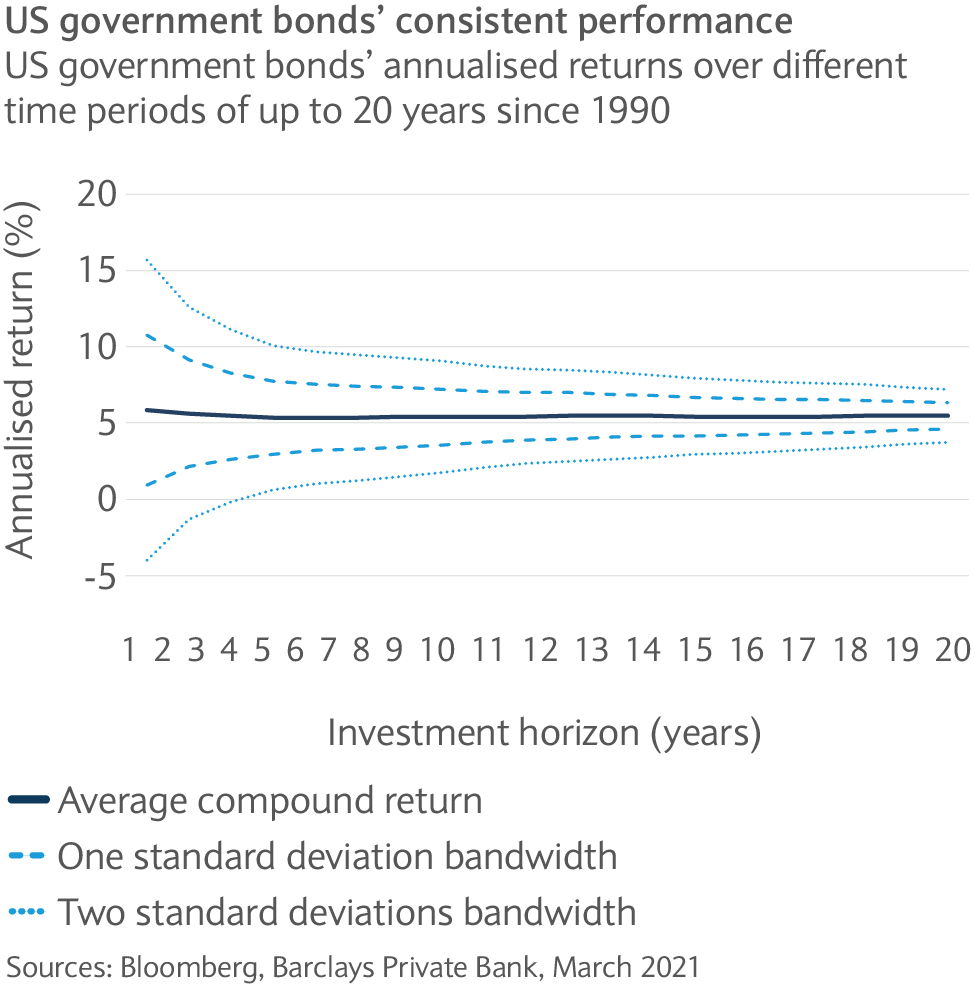
Government bonds have been a natural candidate as diversifiers in a portfolio. Investors in Treasuries benefit from a stable income stream and high likelihood of repayment of their initial investment. For this reason, they typically exhibit a negative correlation with equities, especially during market downturns. Except for cash and certain hedge fund strategies, there are not many asset classes which can provide such portfolio protection. Having the status of a safe-haven investment, government bonds have established themselves as one of the core asset classes.
US government bonds are characterised by markedly different holding-period return signature compared to US equities. Using the historical returns from January 1990 to February 2021, US Treasuries have consistently posted a positive performance for investment horizons longer that two years (see chart). The average compound return is quite stable across the full holding-period spectrum at around 5.5%.
As such, the steady income and low volatility potential of government bonds, as well as their historical negative correlation with US equities, support their appeal for inclusion in a multi-asset portfolio.
Sources of government bond returns
Government bond returns are generated from three sources. First, investors receive an income stream through periodic coupon payments for each bond holding in their portfolios.
Second, as bonds age and roll down the yield curve, a capital gain is generated. Longer-duration bonds provide a compensation for higher uncertainty associated with longer investment horizons. As such, rolldown return is a consequence of the term premium.
Third, valuation adjustments are driven by mark-to-market changes in the spot yield curve. If the interest rates rise (fall) the bond price decreases (increases). This is a consequence of the inverse relationship between the present value of a stream of cash flows and the discount rates. Therefore, investors who trade bonds in the secondary market prior to the maturity are exposed to the interest rate risk.
Beyond the core
Equities and government bonds lie at the heart of most portfolios, and they are likely to remain the brightest binary star in the investment universe. However, in a post- pandemic world characterised by a strong recovery and rising interest rates and inflation, some of the historical relationships between asset classes might be put to the test.
At such times, a multi-asset class approach has attractions. It is worth considering additional sources of income such as high-yielding bonds and private markets. Alternative portfolio diversifiers, like hedge funds, can play a role as well. Real assets, like property, tend to provide some protection against the effects of rising inflation. Finally, selection and active management appear to be more important than ever.
Related articles
Investments can fall as well as rise in value. Your capital or the income generated from your investment may be at risk.
This communication:
- Has been prepared by Barclays Private Bank and is provided for information purposes only
- Is not research nor a product of the Barclays Research department. Any views expressed in this communication may differ from those of the Barclays Research department
- All opinions and estimates are given as of the date of this communication and are subject to change. Barclays Private Bank is not obliged to inform recipients of this communication of any change to such opinions or estimates
- Is general in nature and does not take into account any specific investment objectives, financial situation or particular needs of any particular person
- Does not constitute an offer, an invitation or a recommendation to enter into any product or service and does not constitute investment advice, solicitation to buy or sell securities and/or a personal recommendation. Any entry into any product or service requires Barclays’ subsequent formal agreement which will be subject to internal approvals and execution of binding documents
- Is confidential and is for the benefit of the recipient. No part of it may be reproduced, distributed or transmitted without the prior written permission of Barclays Private Bank
- Has not been reviewed or approved by any regulatory authority.
Any past or simulated past performance including back-testing, modelling or scenario analysis, or future projections contained in this communication is no indication as to future performance. No representation is made as to the accuracy of the assumptions made in this communication, or completeness of, any modelling, scenario analysis or back-testing. The value of any investment may also fluctuate as a result of market changes.
Barclays is a full service bank. In the normal course of offering products and services, Barclays may act in several capacities and simultaneously, giving rise to potential conflicts of interest which may impact the performance of the products.
Where information in this communication has been obtained from third party sources, we believe those sources to be reliable but we do not guarantee the information’s accuracy and you should note that it may be incomplete or condensed.
Neither Barclays nor any of its directors, officers, employees, representatives or agents, accepts any liability whatsoever for any direct, indirect or consequential losses (in contract, tort or otherwise) arising from the use of this communication or its contents or reliance on the information contained herein, except to the extent this would be prohibited by law or regulation. Law or regulation in certain countries may restrict the manner of distribution of this communication and the availability of the products and services, and persons who come into possession of this publication are required to inform themselves of and observe such restrictions.
You have sole responsibility for the management of your tax and legal affairs including making any applicable filings and payments and complying with any applicable laws and regulations. We have not and will not provide you with tax or legal advice and recommend that you obtain independent tax and legal advice tailored to your individual circumstances.
THIS COMMUNICATION IS PROVIDED FOR INFORMATION PURPOSES ONLY AND IS SUBJECT TO CHANGE. IT IS INDICATIVE ONLY AND IS NOT BINDING.