
Market Perspectives September 2020
Financial markets are in fairly upbeat mood. That said, sentiment appears fragile while the focus of investors is on pandemic developments.

04 September 2020
7 minute read
By Nikola Vasiljevic, Zurich Switzerland, Head of Quantitative Strategy
After the spike at the outset of the pandemic, US equity correlations have trended down. Coupled with increasing performance dispersion, this creates many opportunities for skilled stock pickers. But, are equities still attractive for alpha hunters?
Stock prices often plummet in a crisis, with equity volatility and correlations abruptly spiking and being elevated for some time. Market selloffs are frequently driven by macroeconomic news and sentiment. Fundamentals can often be of secondary importance. Many investors can become defensive and ditch equities in favour of risk-off investments, such as government bonds and gold. High equity correlations and low cross-sectional performance dispersion then make stock selection very difficult.
However, after the initial reaction, a new wave of optimism can set in. Although some sectors might be more macro-driven and attractive on an aggregate level, many stock pickers tend to take a more nuanced research approach. As correlations start reverting to their pre-crisis levels and performance dispersion increases, “alpha hunters” swiftly leave their pit boxes and rejoin the “beta grazers”.
The above scenario occurred earlier this year. The initial equities slump of almost 40% saw the VIX volatility index, or the “fear gauge”, surge to 80 points from 20 and US equity correlations hit 0.7 from 0.2. All stocks moved in sync, making it difficult to have high conviction calls on single names. In subsequent months, stocks rallied and risk metrics fell (albeit remaining somewhat elevated, historically speaking). In turn, a wider distribution of returns has aided stock pickers.
The chart shows the S&P 500 over the last five years. Initially, three-month rolling pairwise correlations and realised returns are considered. This shows the aggregate dynamic cross-sectional properties of correlations and return dispersion.
The measures that are particularly relevant for our analysis are the location (median) and dispersion (revealing the interquartile range, defined as the difference in returns between the 75th and 25th percentile) of equity returns.
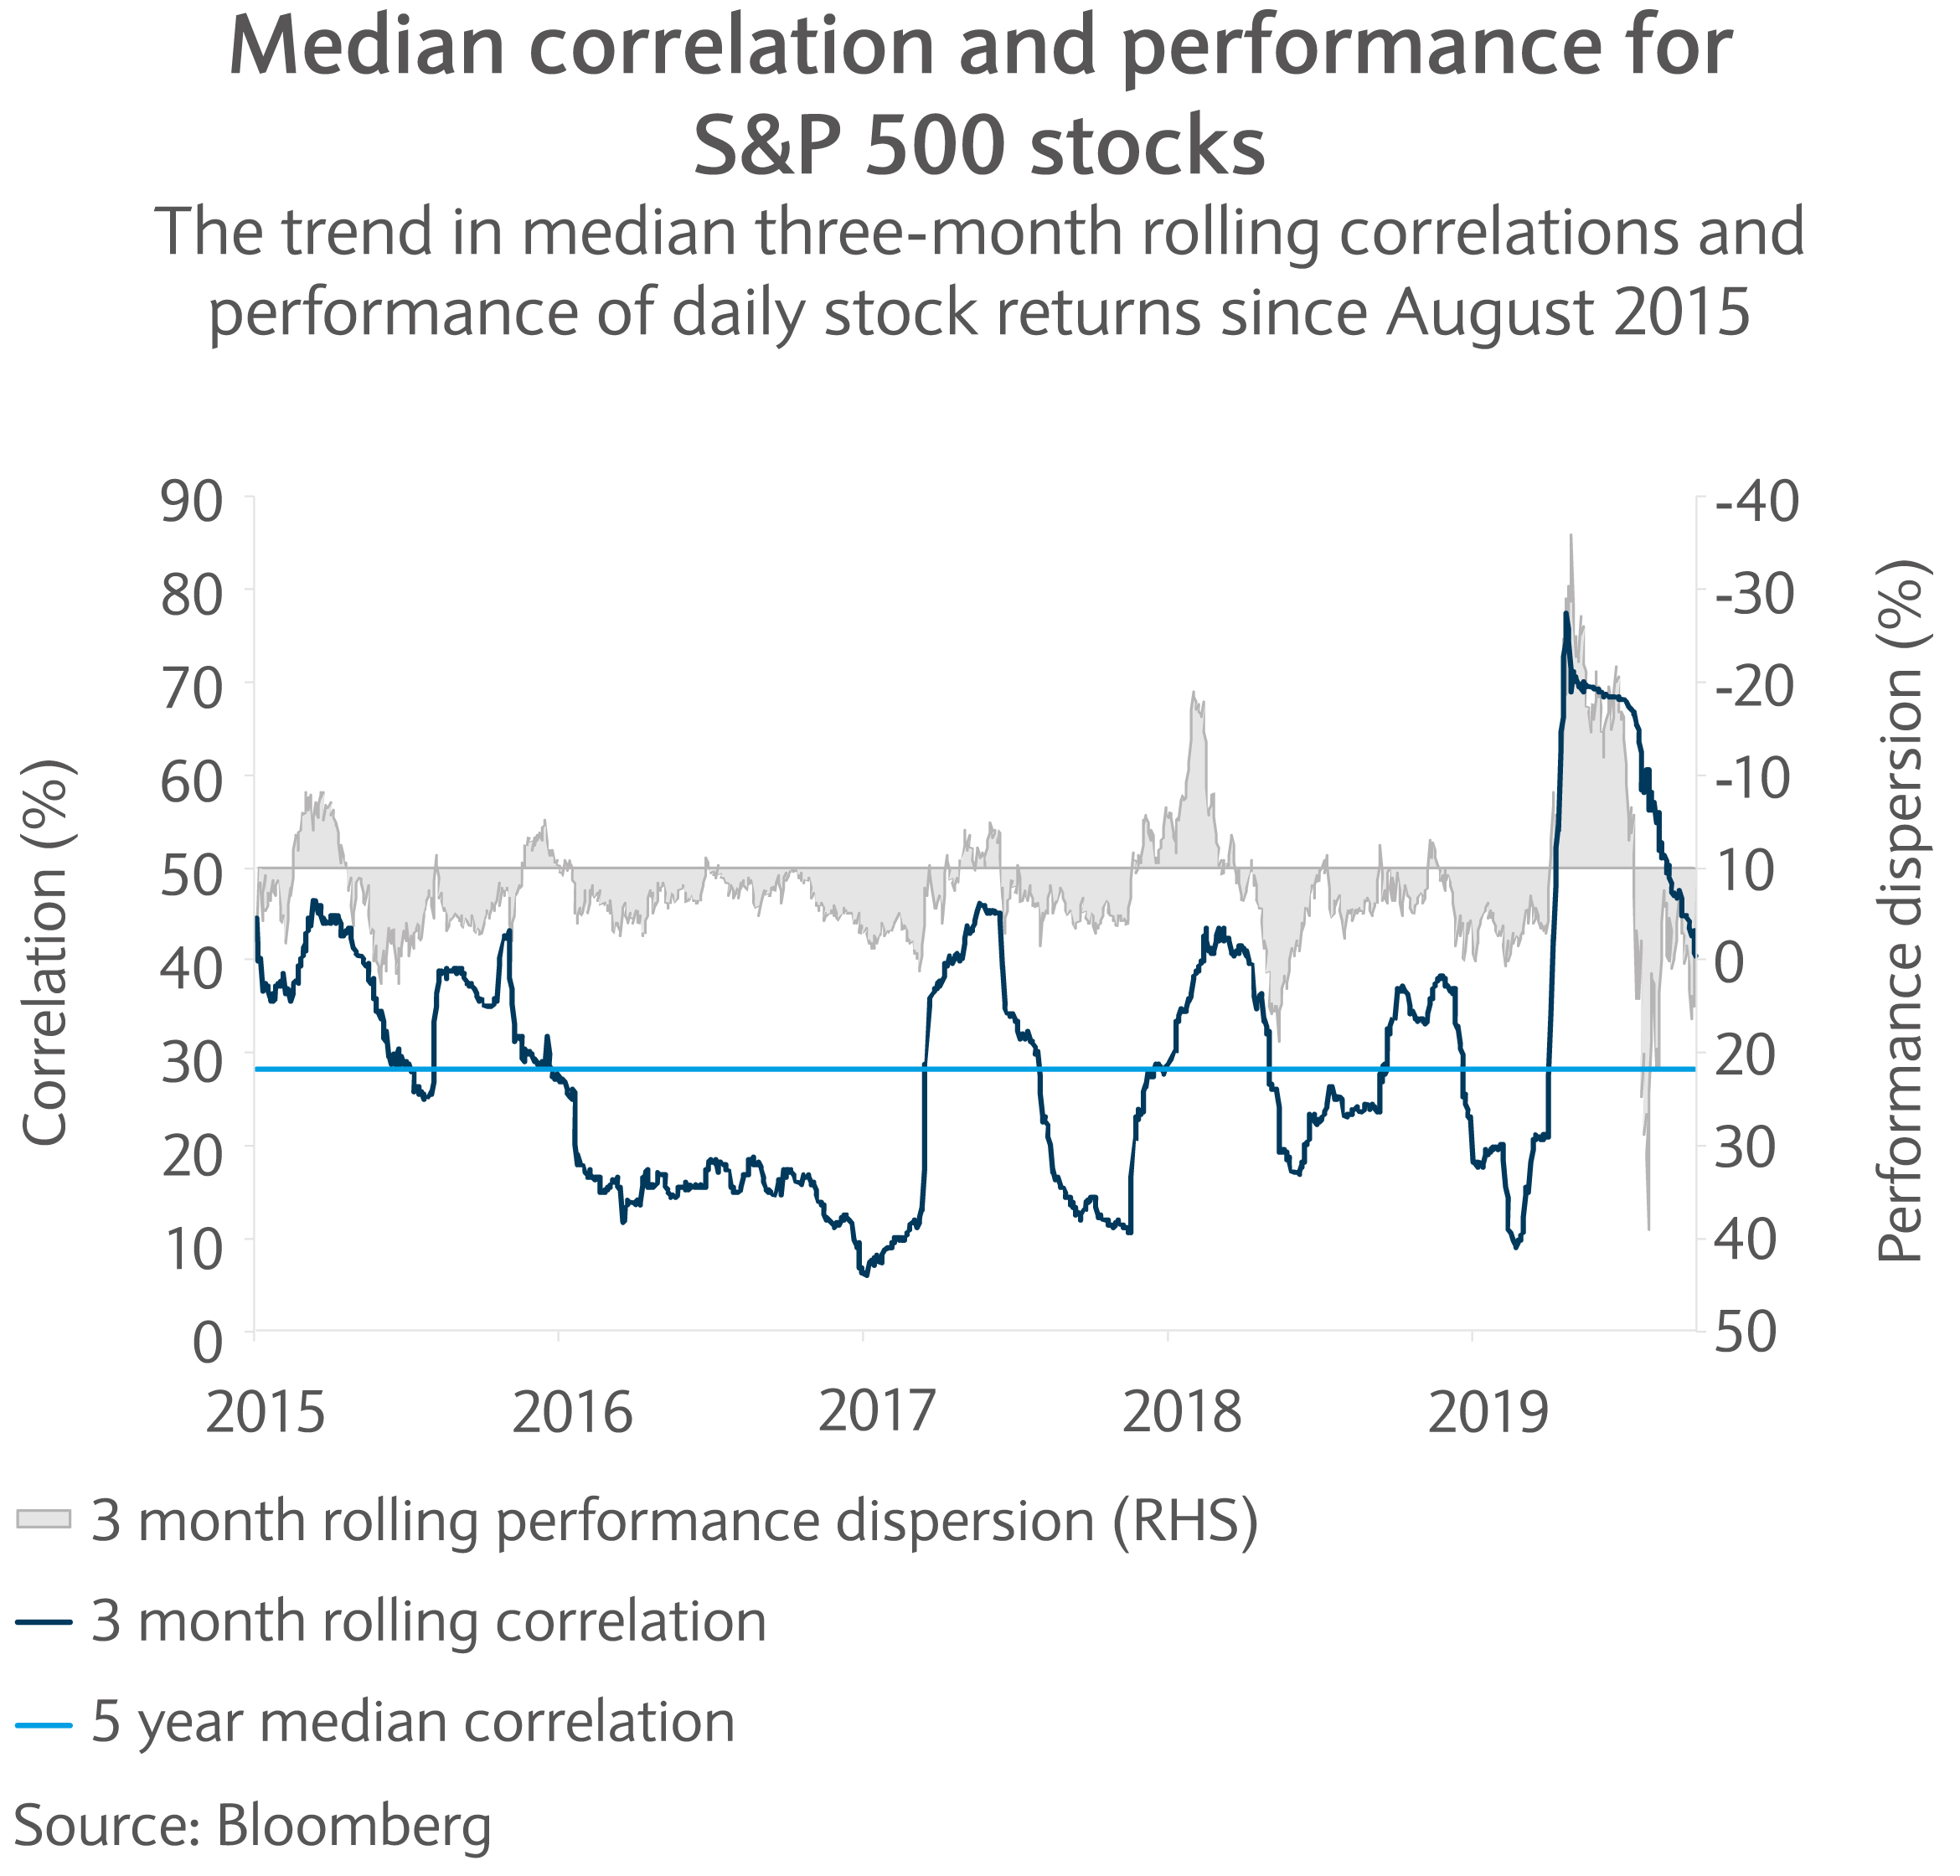
The three-month rolling correlations and realised returns reveal that stock-picking opportunities have much improved since March. The median correlation is around 0.4, down from 0.7 at its peak but above the five-year average of around 0.3. The median three-month realised return has surged to around 10% from -35% in the same five-month period.
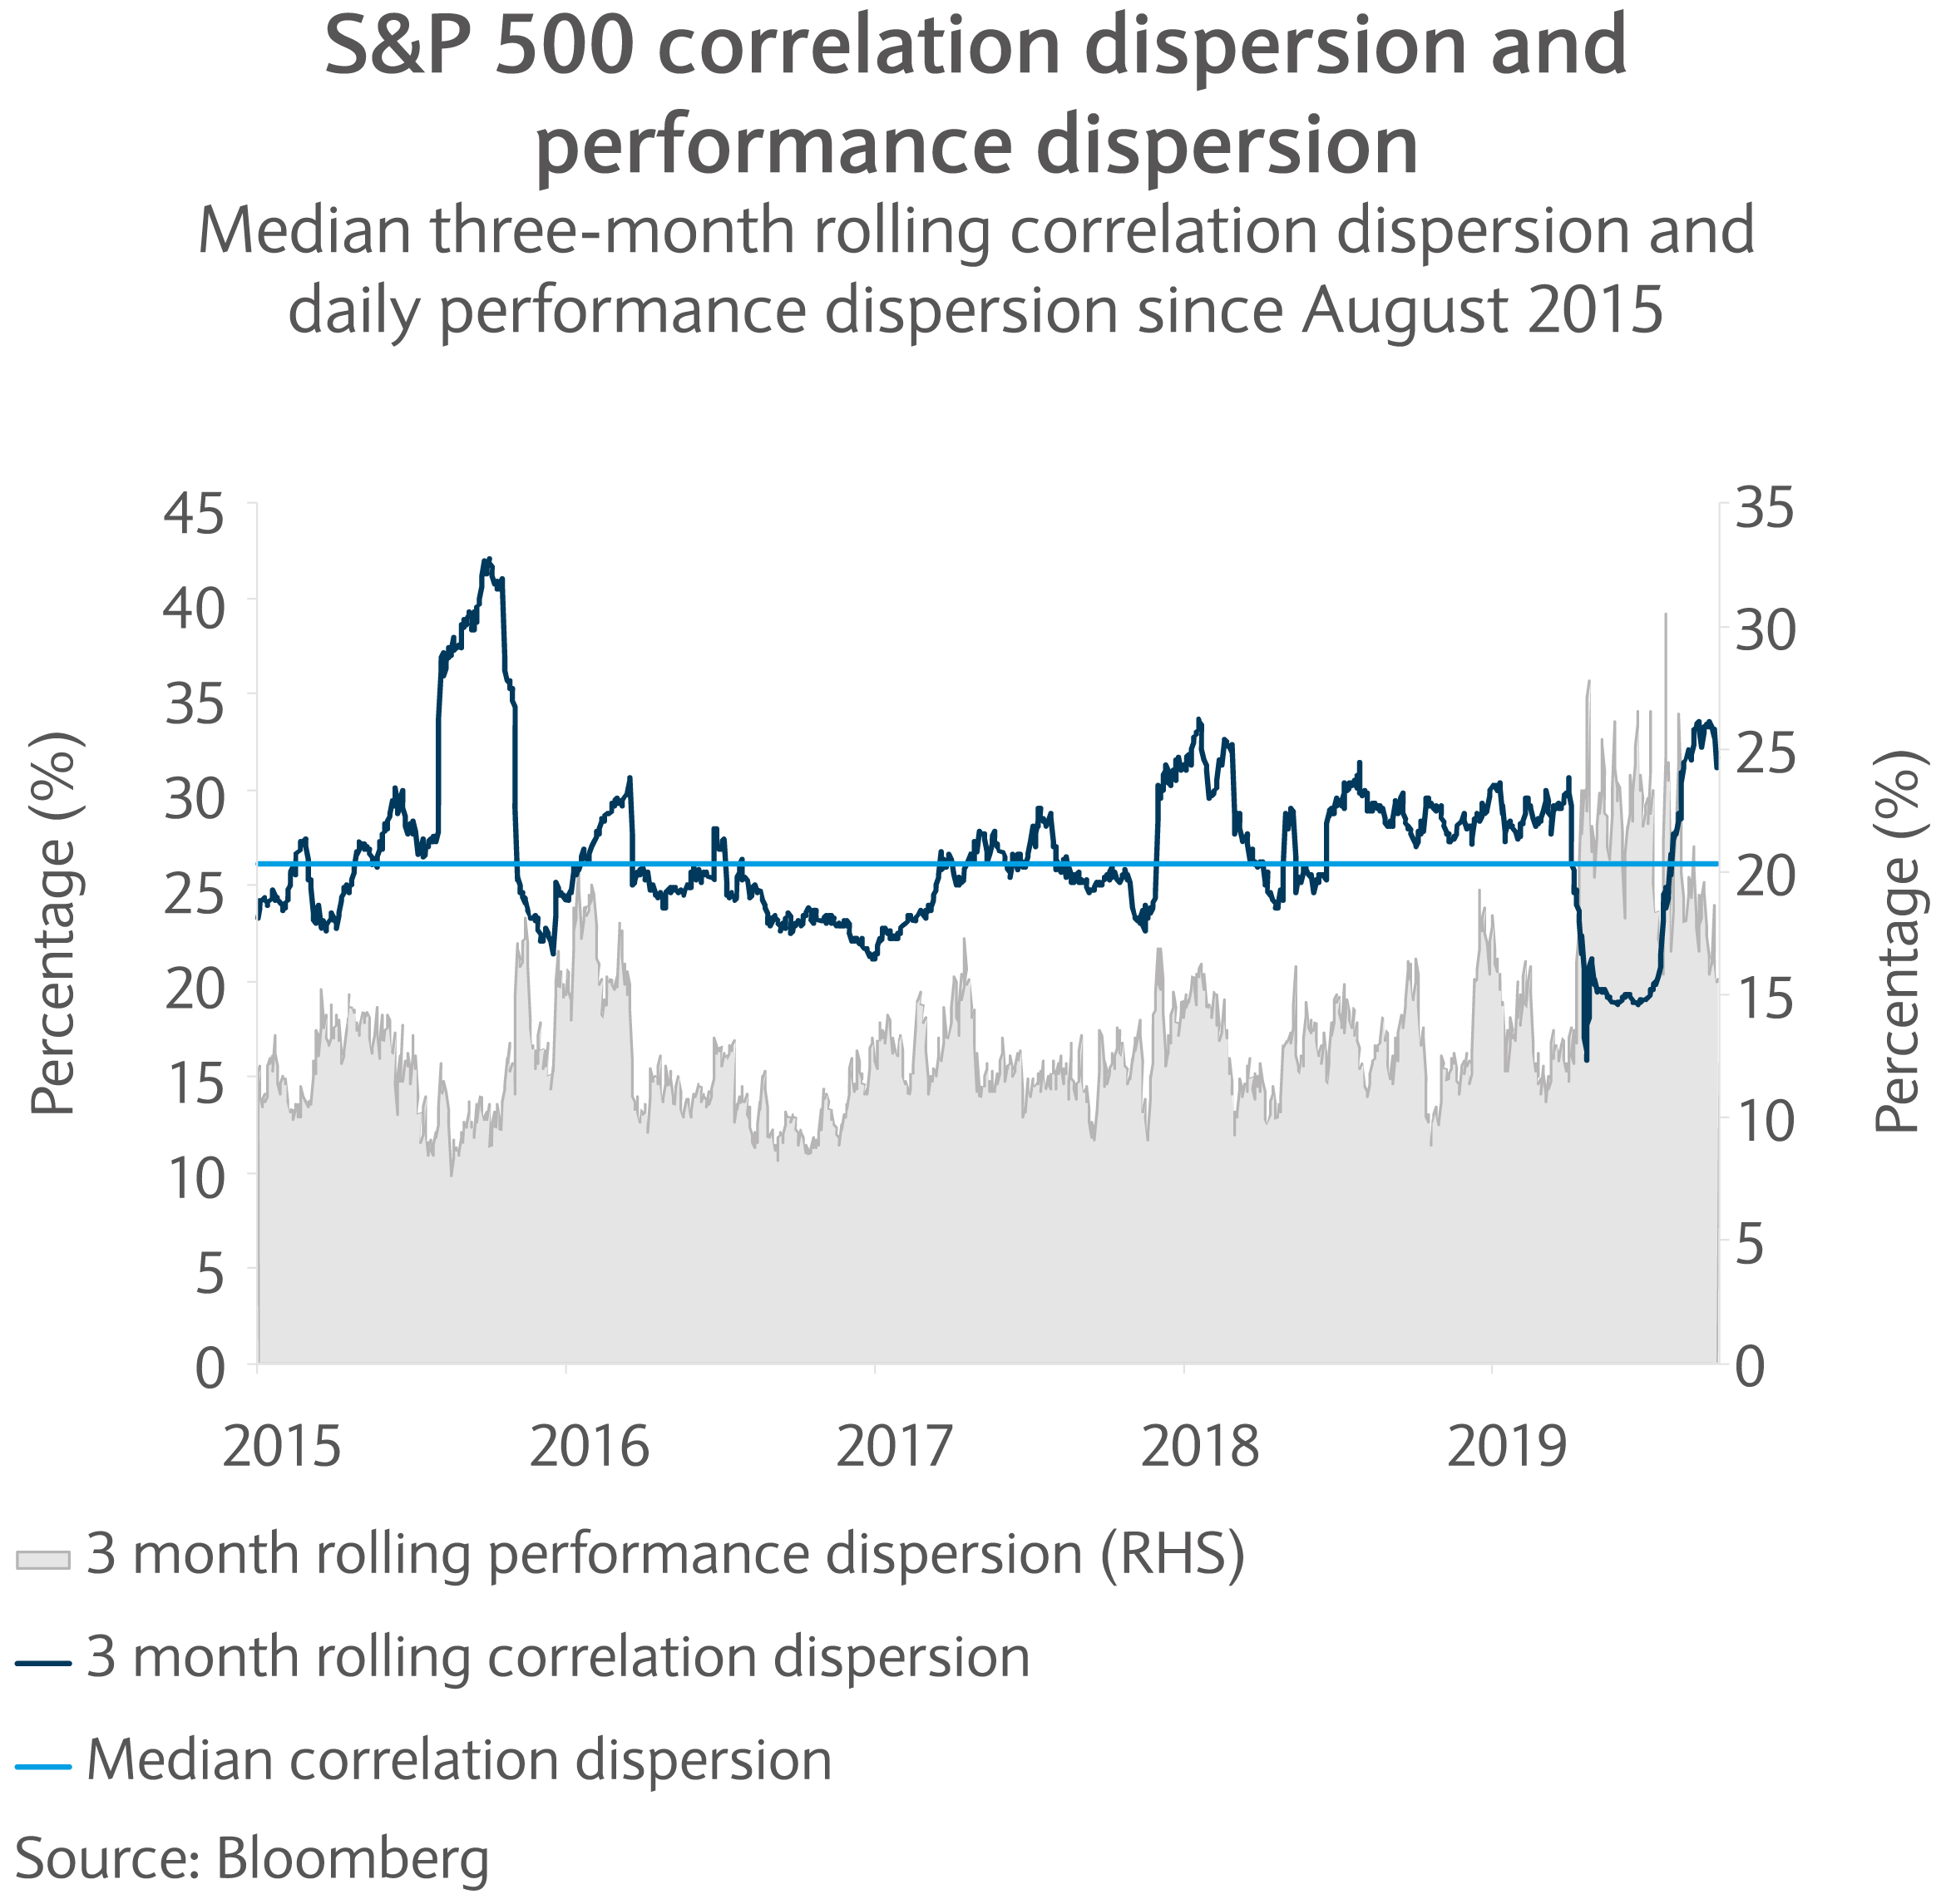
Similarly, correlation dispersion and performance dispersion (see chart) have widened since March. Recently, the dispersion has somewhat retracted of late. Although it is tempting to conclude that as a result there are fewer opportunities for stock pickers, it is worth investigating each sector too.
To further analyse US equity returns, stocks are grouped by sectors using the same quantitative procedure as in the previous section. Sectors with elevated, but downward-trending, correlations and wide dispersion of returns and correlation should offer the best alpha-generating opportunities.
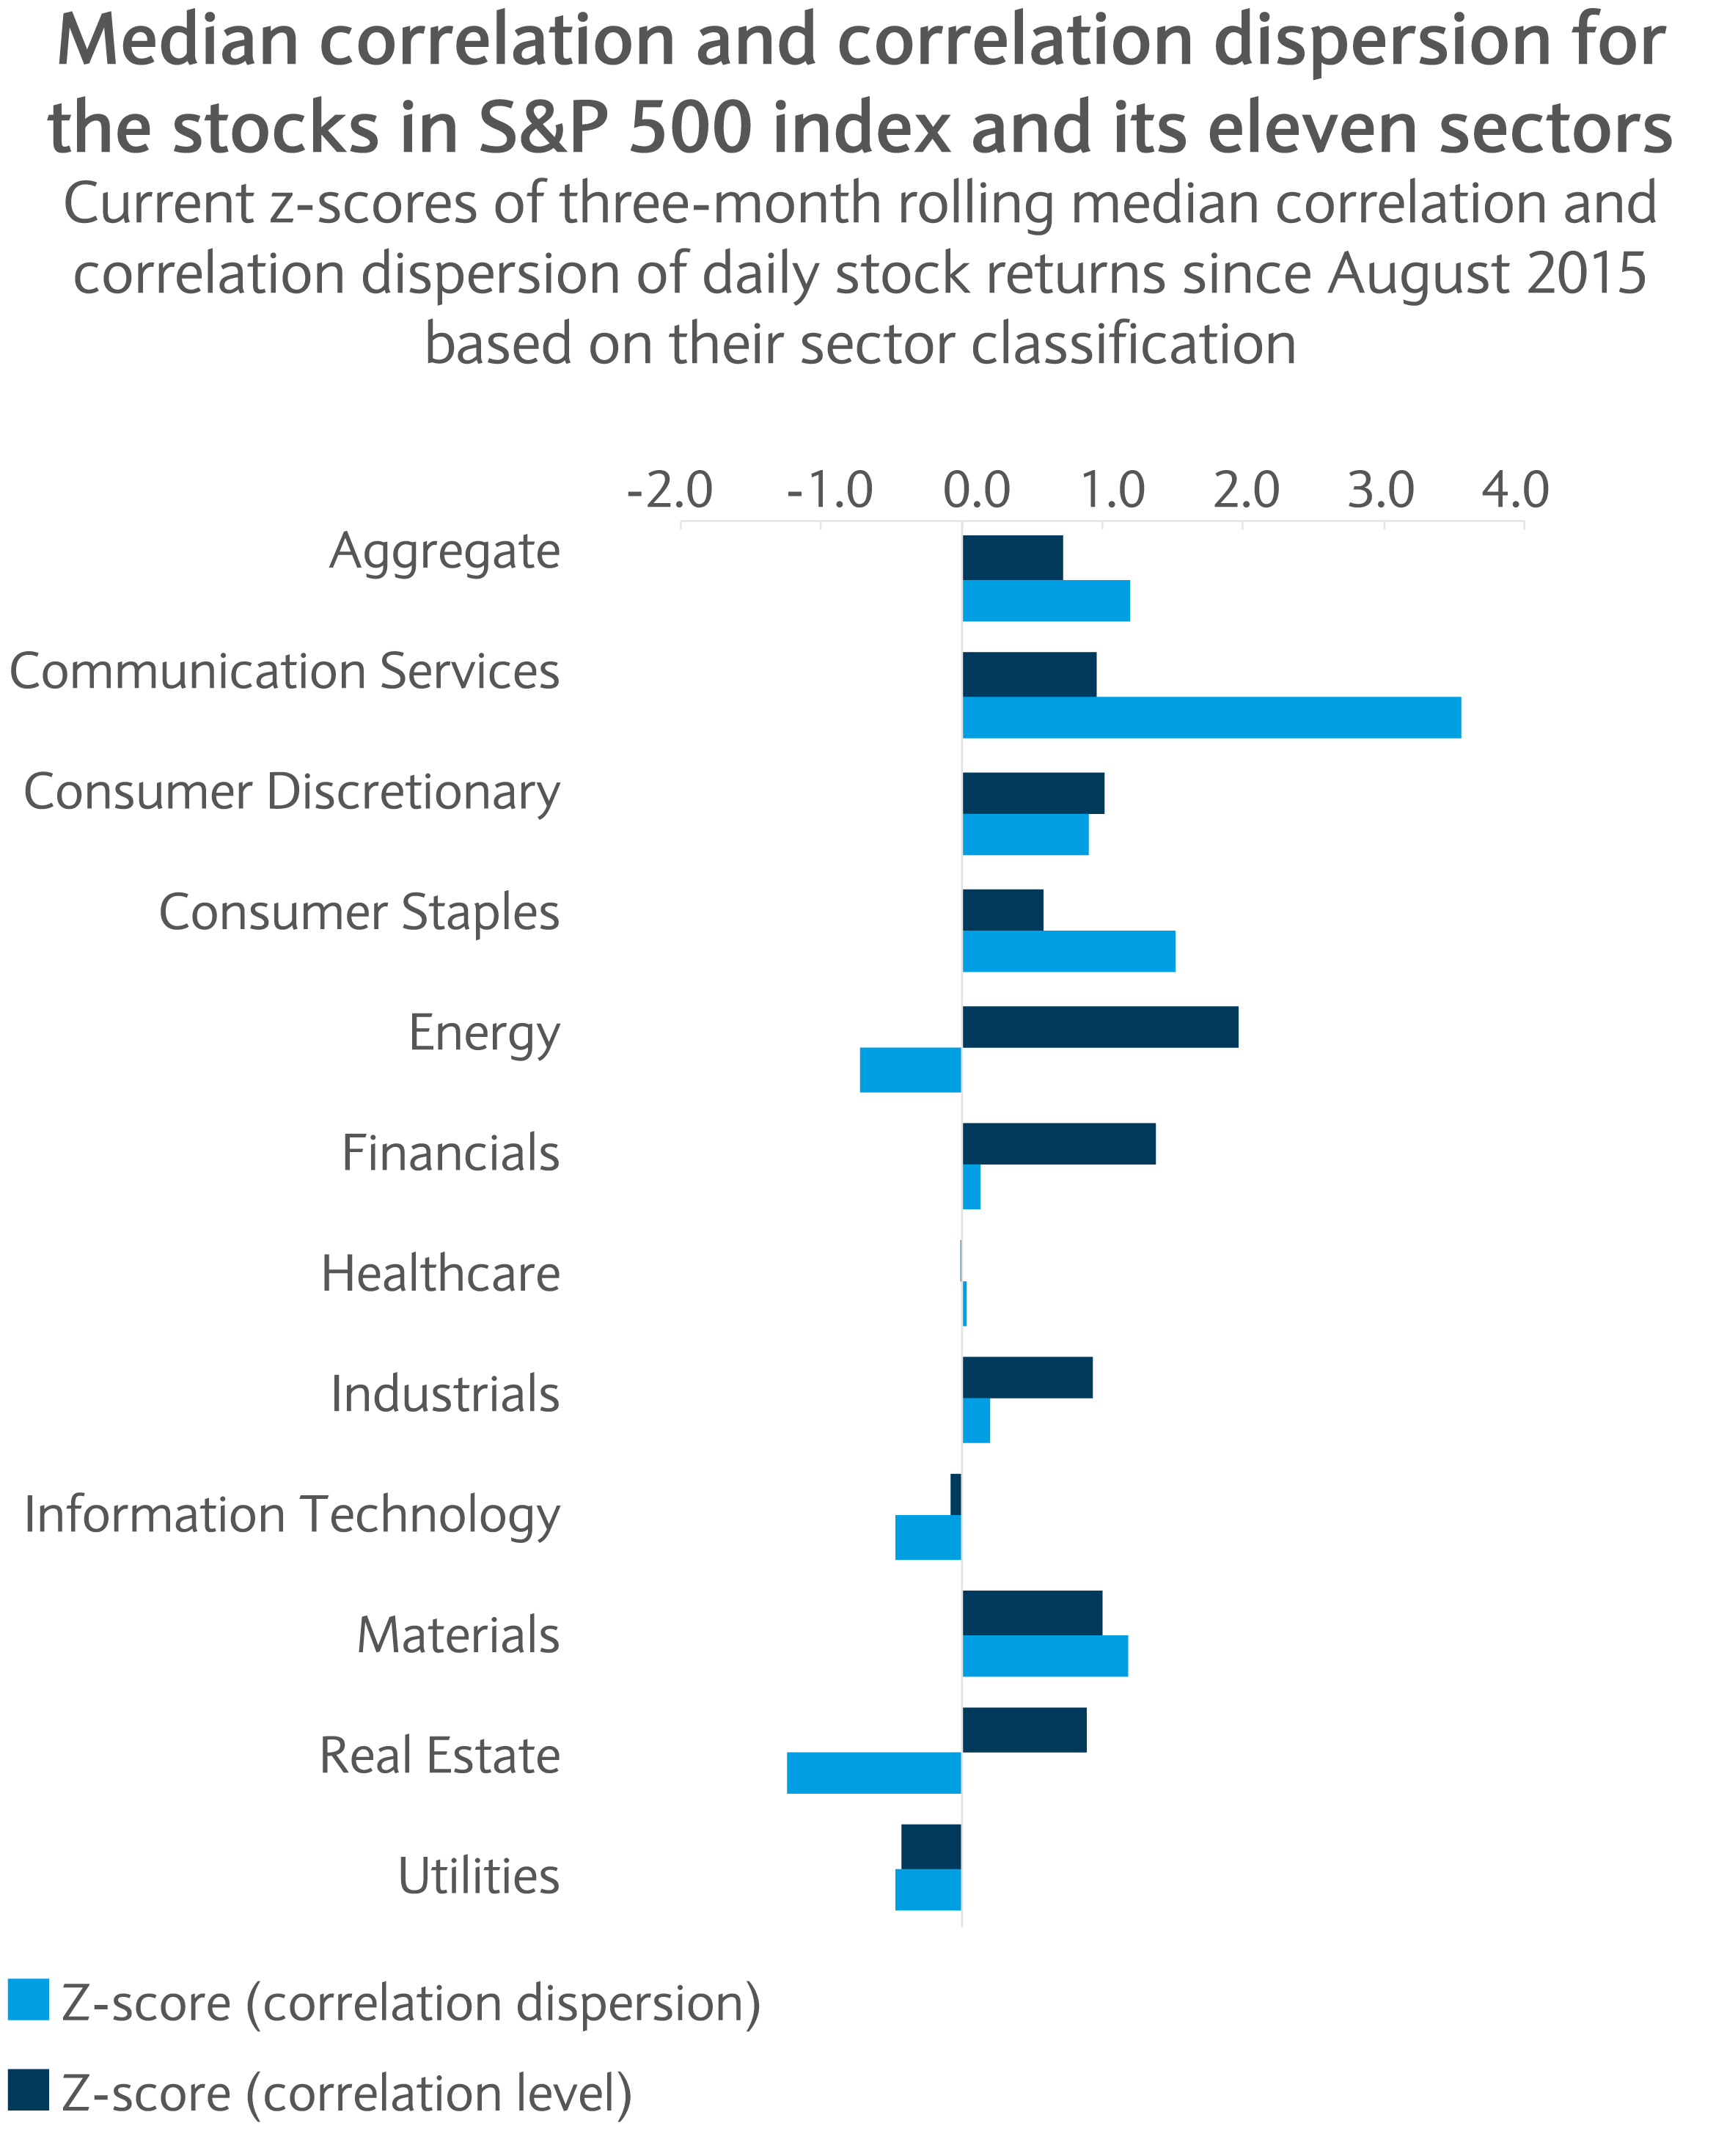
The bar chart shows that almost all sectors still have elevated correlations relative to the last five years (or a z-score above zero). Utilities appear to be an outlier, their median intra-sector correlation is the highest (irrespectively of the market environment). Healthcare and information technology have returned to their median five-year levels.
Given recent fast-paced changes within these two sectors, it is not surprising they have adjusted more quickly than others. Communication services, consumer discretionary and staples, industrials and materials are in the “sweet spot” for stock picking. Energy and real estate lag and appear to be more macro-driven.
Uncertainty has reached new levels this year. Many risks still lurk – the pandemic and geopolitical tensions being the most acute ones. Historically elevated equity valuations, amid currents favouring deglobalisation, are worrying. Nevertheless, the US outlook appeared solid before the COVID-19 outbreak and the country’s infection trend has been healthier since June, despite local spikes in some states.
Unprecedented, generous fiscal policy stimuli around the globe have brought some peace of mind to investors. Perhaps most importantly, containment measures could be paving the way for new secular trends and have accelerated some trends in many industries.
Overall, bouts of volatility are to be expected this year, especially on COVID-19 vaccine developments, Brexit trade negotiations, the US presidential election and US-Sino relations. However, unless there is another major external shock, it is unlikely that correlations will revisit those seen in March.
Divergence between sector and stock returns, including those within sectors, seems likely. Irreversible long-term trends, potential inefficiencies and asymmetries caused by swift and massive fiscal injections, central banks pumping more liquidity into markets and growing spreads in fundamental measures (such as corporate debt, valuation, margins and supply chain robustness) all look favourable signals for alpha hunters.
Financial markets are in fairly upbeat mood. That said, sentiment appears fragile while the focus of investors is on pandemic developments.

Barclays Private Bank provides discretionary and advisory investment services, investments to help plan your wealth and for professionals, access to market.
This communication:
Any past or simulated past performance including back-testing, modelling or scenario analysis, or future projections contained in this communication is no indication as to future performance. No representation is made as to the accuracy of the assumptions made in this communication, or completeness of, any modelling, scenario analysis or back-testing. The value of any investment may also fluctuate as a result of market changes.
Barclays is a full service bank. In the normal course of offering products and services, Barclays may act in several capacities and simultaneously, giving rise to potential conflicts of interest which may impact the performance of the products.
Where information in this communication has been obtained from third party sources, we believe those sources to be reliable but we do not guarantee the information’s accuracy and you should note that it may be incomplete or condensed.
Neither Barclays nor any of its directors, officers, employees, representatives or agents, accepts any liability whatsoever for any direct, indirect or consequential losses (in contract, tort or otherwise) arising from the use of this communication or its contents or reliance on the information contained herein, except to the extent this would be prohibited by law or regulation. Law or regulation in certain countries may restrict the manner of distribution of this communication and the availability of the products and services, and persons who come into possession of this publication are required to inform themselves of and observe such restrictions.
You have sole responsibility for the management of your tax and legal affairs including making any applicable filings and payments and complying with any applicable laws and regulations. We have not and will not provide you with tax or legal advice and recommend that you obtain independent tax and legal advice tailored to your individual circumstances.
THIS COMMUNICATION IS PROVIDED FOR INFORMATION PURPOSES ONLY AND IS SUBJECT TO CHANGE. IT IS INDICATIVE ONLY AND IS NOT BINDING.