-
""

Quantitative strategy – inflation anchoring

Anchors aweigh

14 November 2022

Lukas Gehrig, Zurich Switzerland, Quantitative Strategist; Nikola Vasiljevic, Zurich, Switzerland, Head of Quantitative Strategy.

Key points

  • Well-anchored inflation expectations are key to helping central banks preserve price stability
  • However, our analysis suggests that the post-pandemic charge in prices has weakened inflation anchoring expectations: not only in the US, but in many other developed markets
  • De-anchored inflation expectations are rarely good news for financial markets, as higher prices typically hit the performance of equities, bonds, as well as large parts of the hedge fund and commodity universe
  • Within equities, consumer staples and materials sectors usually cope best in an era of low growth and elevated inflation

Amid a storm of data on inflation, economic activity, and labour markets, it can be difficult to pinpoint one’s position or even ascertain the direction of travel. We discuss the importance of inflation anchoring and show how much it has loosened this year, as well as the potential implications for portfolios and the economy. 

Analysis of inflation has been dominated by one topic over the last two decades: the ability of central banks to influence inflation using standard monetary policy tools, also referred to as the flatness of the so-called Phillips Curve.  

After having been declared dead countless times, the Phillips Curve relationship, between the central bank policy rate and the inflation rate, was finally resurrected when the idea of time-varying degrees of inflation-expectation anchoring was added to the standard equation1. This approach explains why monetary policy intervention at times had very little effect on inflation: the expectations were simply too well anchored. 

This anchoring-induced slumber, of inflation, may have encouraged central banks to take actions that were not necessarily linked to their primary goal of price stability, such as saving equity markets (and banks), bailing out governments, and stimulating corporates through a worldwide pandemic.  

In fact, in February 2021, US Federal Reserve (Fed) chair Jerome Powell acknowledged that monetary policy was often run for the average labour market participant, and that weaker segments of the labour market were often hurt by monetary policy which was too strongly tied to its 2% target2. As a result, the Fed intended to let inflation run above 2% for some time to let these weaker segments catch up.

Another kind of 'whatever it takes'

These secondary goals of trying to correct for unfortunate side effects of policy have now been put on ice, with central banks gripped by the fear of persistent runaway inflation. The question on everyone’s mind is: can central banks reaffirm these calming anchors now, bring inflation back towards target, and at what cost? 

The Japanese experience of the last two decades, of having a target at 2%, while core inflation was negative almost 60% of the time since 2000, raises doubts over the ability of central banks to lift inflation expectations against entrenched structural drivers and beliefs.  

Whether central banks can lower expectations is an ongoing experiment. If history is any guide, then former Fed chair Paul Volcker emphasised the need to fully commit to combating inflation, however difficult and painful it may be, in 1981, when he stated3: “In sum, we are in the midst of dealing with the accumulated problems of decades. It is inevitably a painful process – precisely because it has been put off so long.”

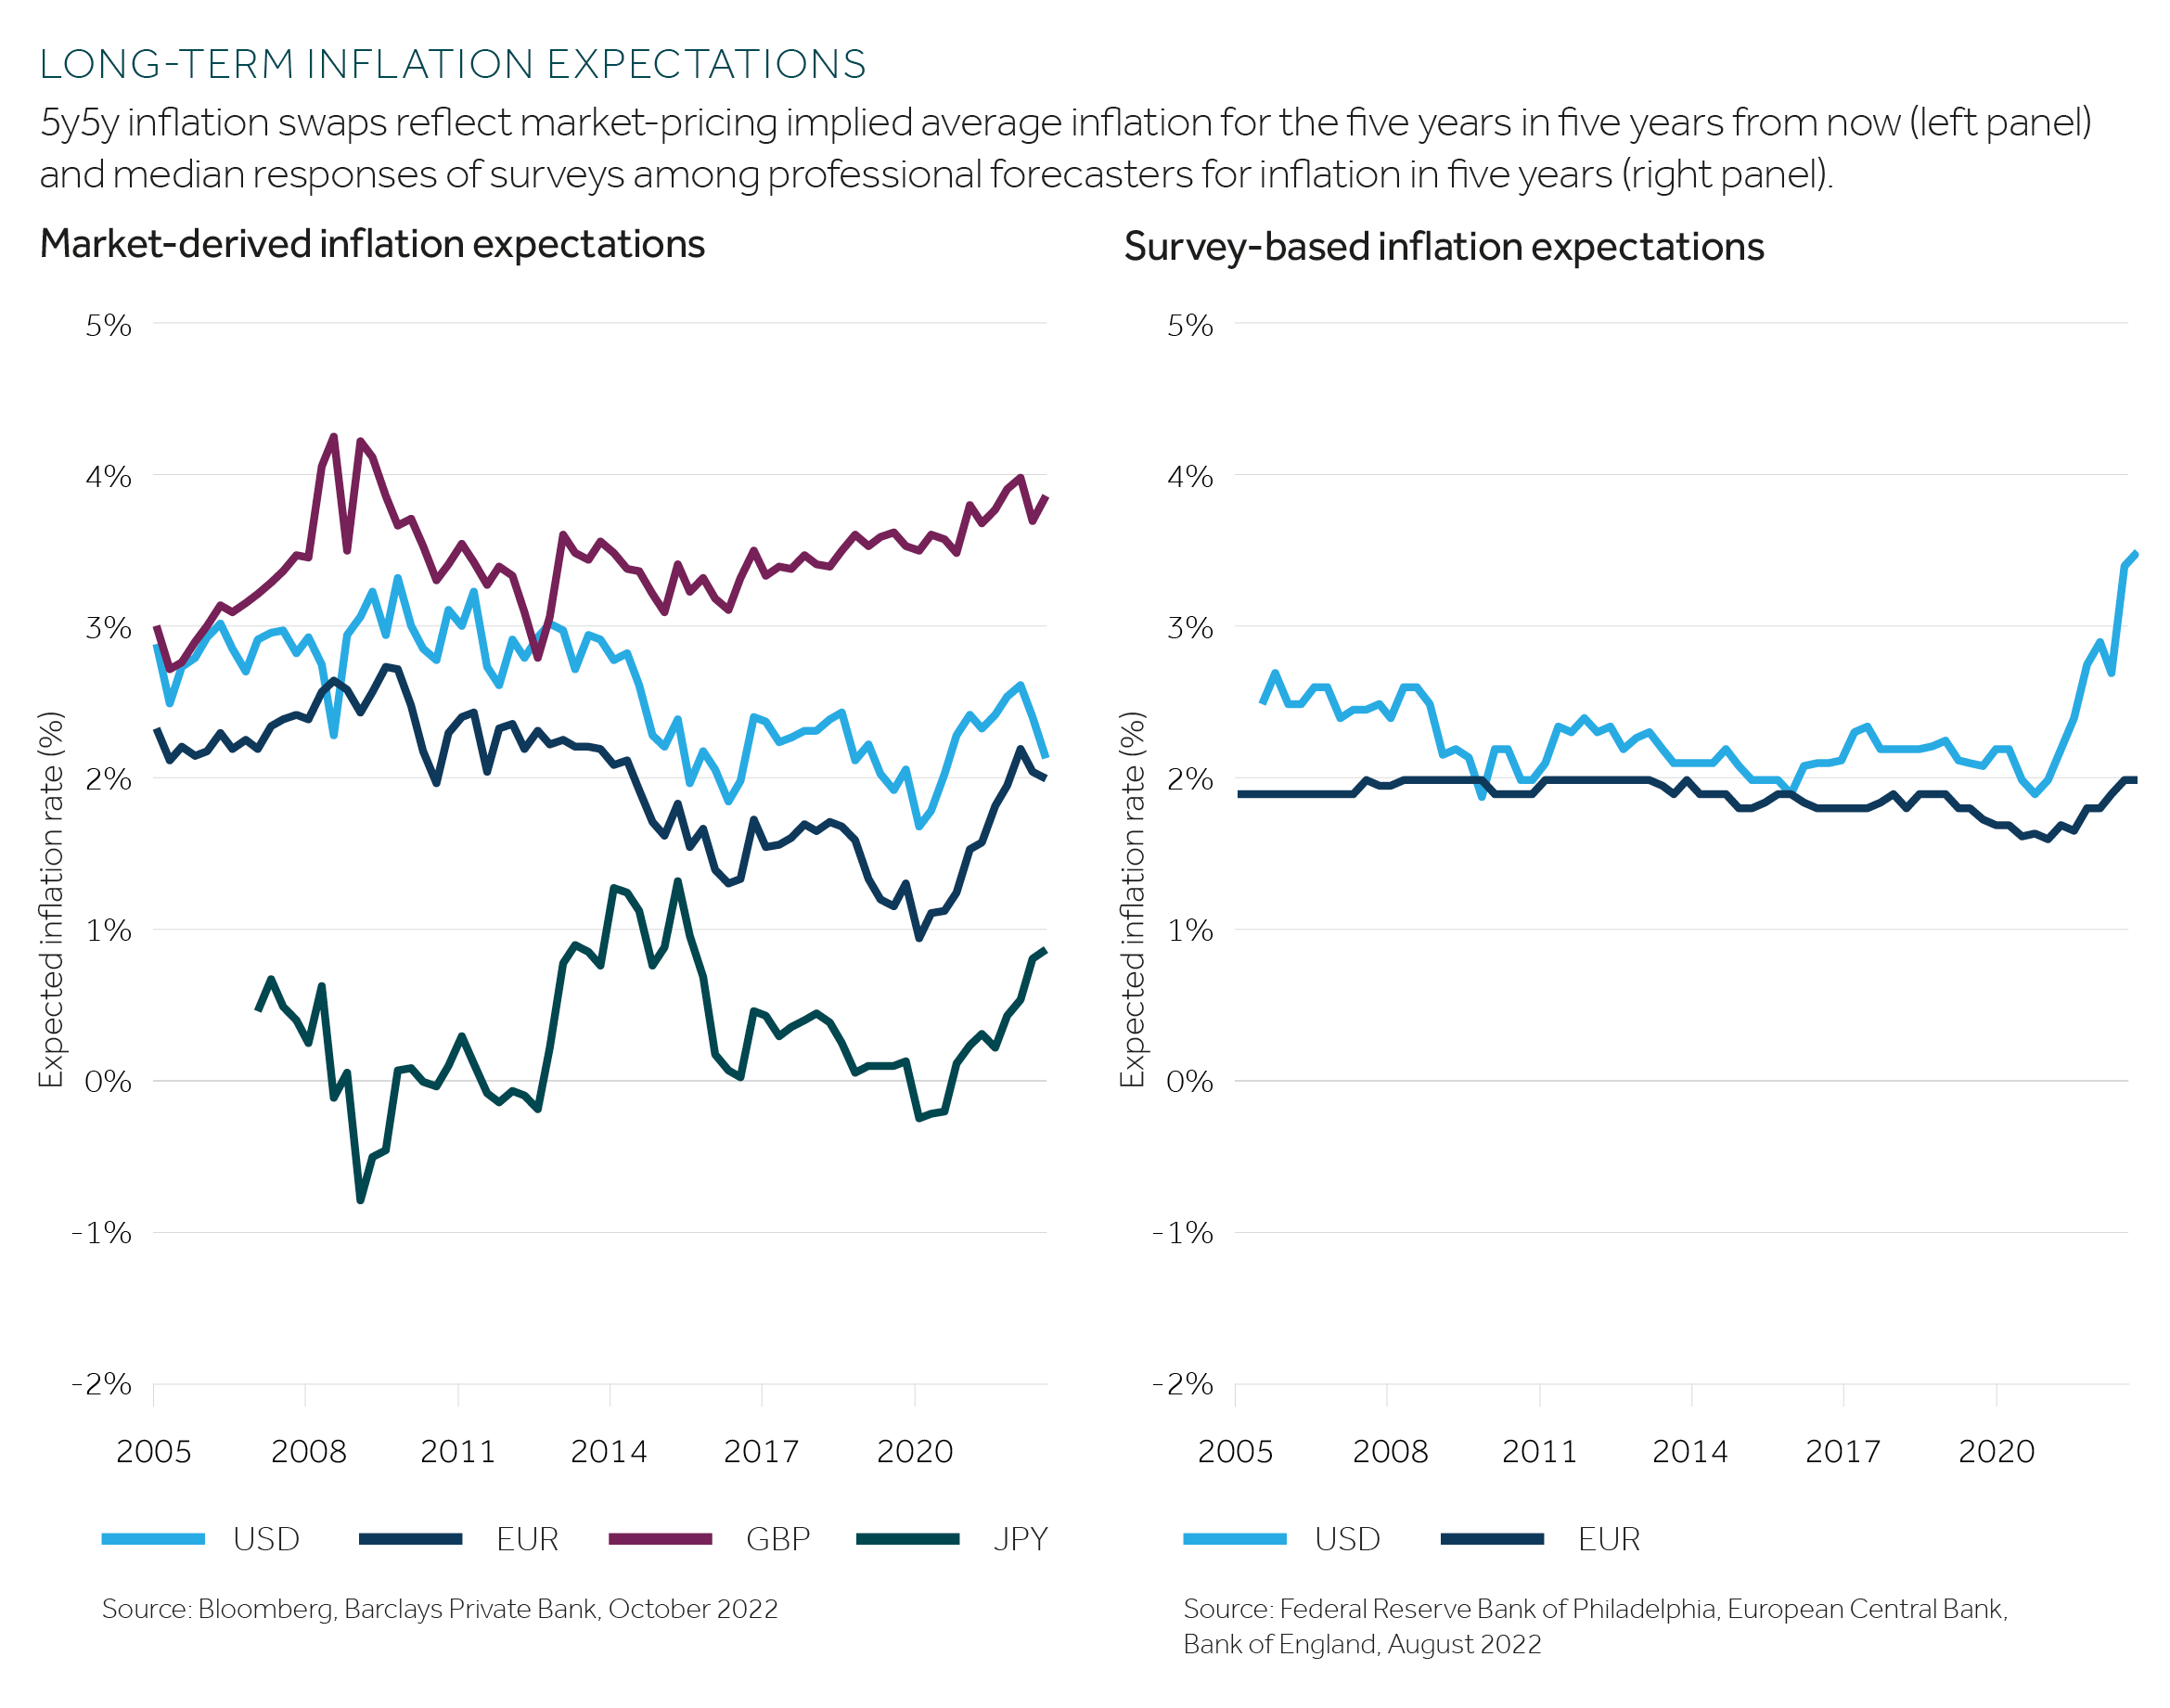
Recent market-derived measures for long-term inflation suggest that this year’s aggressive central bank rate hikes have, for the time being, convinced market participants that inflation will return towards existing inflation targets eventually (see chart, left panel). However, the less forward-looking or less sentiment-driven measures derived from surveys and models suggest that the anchors could have risen for coming years. 

""

Looking at an anchoring history

The indicator that is correct can only be assessed in hindsight, and even then, it will remain uncertain since the “true” inflation expectations and their anchoring cannot be directly measured. 

The econometric approach (see box out) has one distinct advantage – its sparsity in data consumption. Since it only requires a price index series, we can run it back even beyond 1970 while most other measures only date back to 2005.

Inflation expectation anchors

Survey-based: Long-term expectations of inflation rates provide a direct gauge of survey respondents’ inflation anchors. The biggest drawback is the frequency, which can be as low as four times a year. 

Market-based: The 5y5y inflation swap offers a "real time", transaction-based measure for the average market expectation of inflation rates for the five-year period beginning five years from now.  

Econometric approach: Following seminal work by Stock & Watson (2007)4, we combine the power of Monte Carlo simulations with the concept of Markov Chains in a so-called Unobserved Components - Stochastic Variance model to explain the observed inflation history by a level component and a noise one. 

By allowing separate and time-varying volatilities for both components, we can infer whether an increase in the volatilities is actually moving the level (in which case it would affect the anchoring of inflation and therefore affect expectations) or whether it is simply amplifying the noise (in which case the longer-term anchoring would remain unaffected).

The main strength is the sparsity in data usage: one only needs an inflation time series. The main drawback is the strong assumption one has to make on the data generating process – for instance, should the volatilities be correlated, how are they distributed, and the like. The blindness to all other economic data can be both a strength and a weakness.

This allows us to put the current situation in a historic context and highlight the main difference to the inflationary surge that was observed in 2008, when US personal consumption expenditure (PCE) almost touched 4%: in 2008 the anchors did not budge, but in the 1970s, and now again, the volatility in the underlying inflation “level” increased significantly, prompting a monetary policy emergency. 

The combined surge in level and noise volatility that is estimated for the UK highlights the country’s particularly precarious situation. That said, the much higher readings for noise volatility in the UK are also due to the use of retail prices as an inflation measure, instead of the more stable personal consumption expenditure that is used in the US(see chart).

""

Regional differences

In last year’s Outlook, we termed the joint efforts of fiscal and monetary policy as “fiscal fast-forwarding”. Furthermore, we noted how the US performed better than the eurozone and many other developed economies due to the sheer size of stimulus and its more direct nature. Whereas European governments relied more on automatic stabilisers (such as short-time work) to keep consumption afloat.

The different speeds of fiscal fast-forwarding are now reflected in the inflation rates and the wage dynamics. Wage shares – the share of employee compensation in gross domestic product – are still increasing in the US economy, much like they did after the oil shocks of the 1970s. In the eurozone, however, the share is shrinking, which suggests a smaller risk of an inflationary price-wage spiral.

What is it to markets? 

Strong inflation anchors have a calming effect, not only on companies and households, who can plan ahead easier, but also on markets. With uplifted anchors, market participants’ longer-term opinions may be affected by single inflation-data prints, making them more short-sighted. Central banks, on the other hand, understand that mistaking expectations as well-anchored, when they are not, is much more costly than overtightening the policy5

Uprooted expectations imply elevated inflation rates beyond 2023, and increased inflation volatility. That said, the peak should be reached next year.

The best indicator for spotting the peaks of inflation seen in the 1970s was when unemployment rates started to increase significantly. 

Undoubtedly, today’s tight labour markets are a reason why some investors are on the side lines, often a poor strategy as turbulent markets can also be good entry points for those investing for the long term. To be comfortable investing in tough times, we suggest looking beyond inflation and considering macro factors more broadly. 

Navigating stormy seas

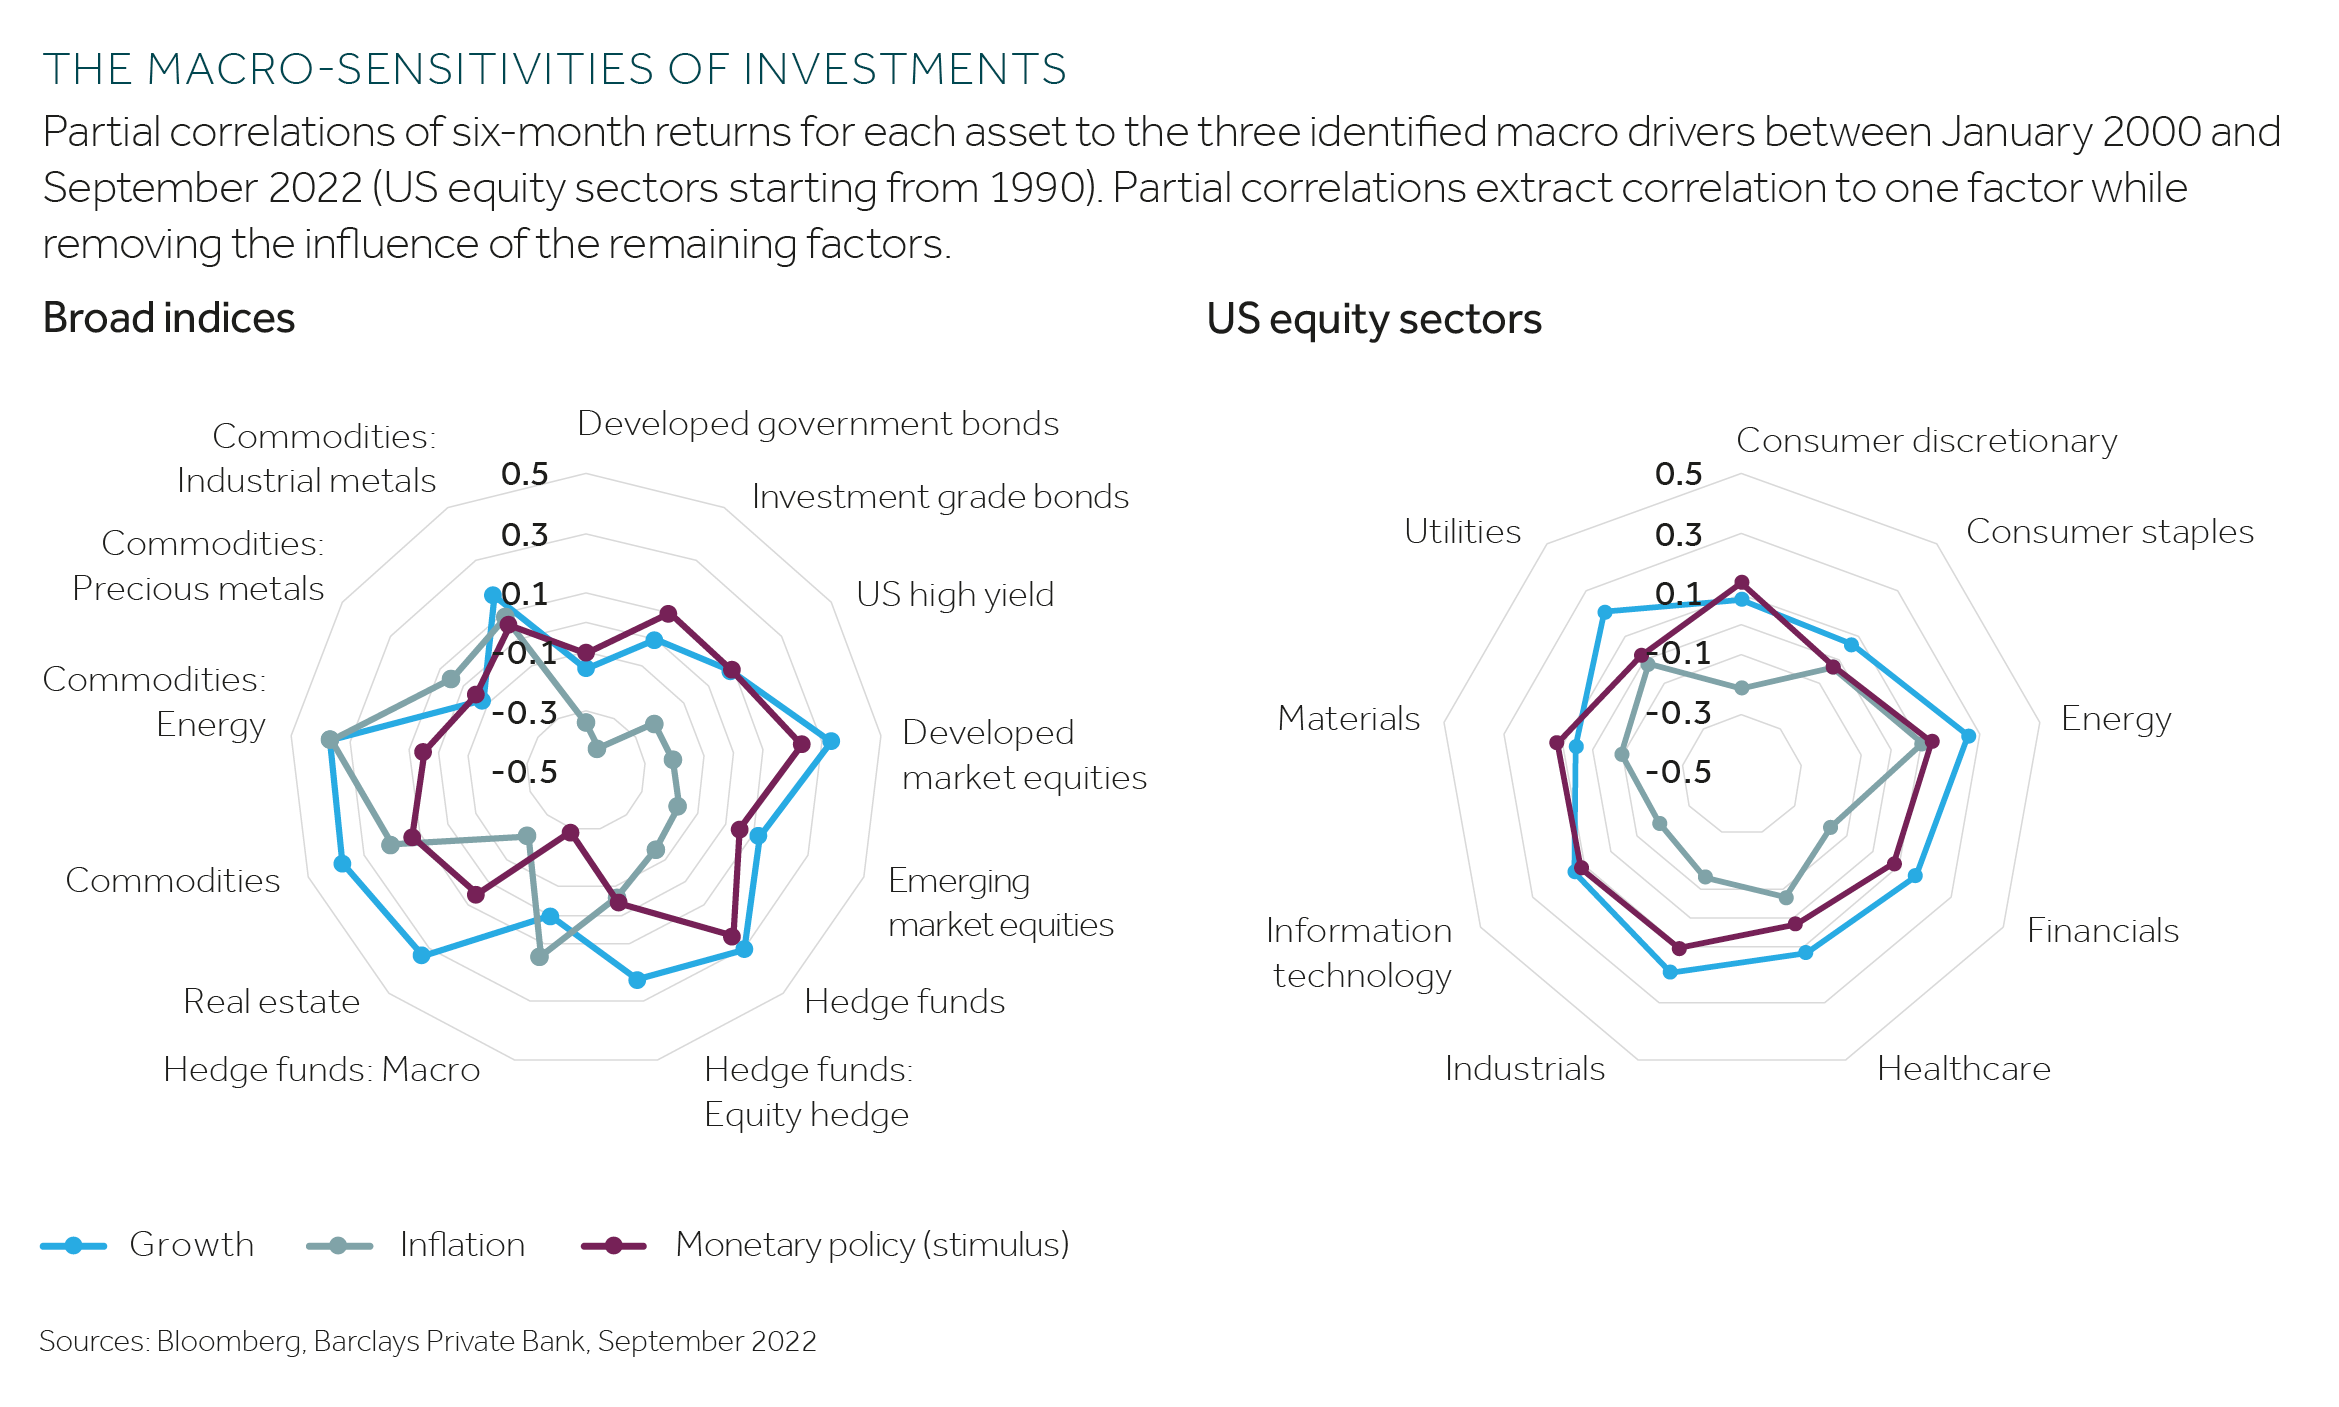
When deriving implications for portfolio construction from macro projections, it can be useful to focus on the sensitivity of an investment to macro factors one at a time. A simple way to do so is to build factors for growth, inflation, and monetary policy stimulus6, and to then study partial correlations of historical performance for each of these factors. 

The use of partial correlations (see chart) prevents costly errors, such as mistaking equities for inflation protection just because inflation usually goes along with growth. When properly separated, it is obvious that the so-called risk-on bucket, consisting of equities, hedge funds, real estate, and large parts of the commodities universe, is heavily reliant on growth (or its short-term supplement monetary policy stimulus) in order to thrive. 

Inflation by itself, however, is detrimental to most investments considered here, and only macro hedge funds, energy, and commodities are likely to profit from it.

""

Trimming the sails with a sectoral twist

A more nuanced investment strategy is in order when investing in especially volatile times, rather than one of simply avoiding equities. Looking at the macro-sensitivities of equity sector performance in the US, consumer staples and materials can best cope in an environment of low growth and elevated inflation. Should inflation surprise to the downside, however, consumer discretionary could thrive in an otherwise low-growth environment.

Heightened inflation volatility as a result of less-well anchored expectations also suggests that a diversified approach with regards to inflation sensitivity makes sense beyond the peak inflation rates.

Related articles

""

Global Outlook 2023

As investors near the end of a tough year, full of twists and turns, our bumper Outlook 2023 takes a look at prospects for financial markets next year.