Right after the shortest recession on record, many market participants are already eyeing inflation rates and economic activity for signs of another recession – one of a very different kind. We provide a typology of recessions, study their effects on financial markets, and assess what this means for the next one.
The term recession is widely used but lacks a clear definition. In this article we employ the definition by the economists at the National Bureau of Economic Research (NBER). According to their definition, a recession or economic contraction describes the period between a peak and a trough in economic activity. To define these turning points for the US economy, a committee looks at a range of monthly activity indicators albeit without following a rigid rule.
The longest recession since 1900 for the US spanned several years, starting in 1929, while the shortest one was the most recent, pandemic-induced recession that only lasted two months.
Recessions come in different shapes and with differing geographical reach. In the following, we offer a typology of recessions and study the performance of assets under these regimes. We then analyse the current situation from an investor’s perspective.
The typology of recessions
Recessions are classified by the shapes (whether a V-, U-, W-, L- or K-shaped one) they imprint on activity indicators as well as the context in which, or trigger upon which, they occur. Neither typology is generally accepted or particularly well-defined. While classifying recessions by a letter, makes their course easily visualised, the most fitting letter only becomes apparent in hindsight. A V-shaped one may, for example, lead into a W-shaped downturn.
For a forward-looking approach we find it more instructive to classify past events by their context. Very generally, we would sort them into the following four types:
- Business cycle, boom/bust recession
- Balance sheet recession
- Supply-side shock recession
- Demand-side shock recession
The business cycle variant is often brought about by central banks tightening the reins of monetary policy as a reaction to signs of overheating in an economy.
A balance sheet recession starts more subtly, when firms and banks see their assets lose value and then cut investment and lending to improve their balance sheets. This further hurts growth and asset valuations, potentially leading to a downward spiral. In contrast to the business cycle alternative, cutting rates does not alleviate the issue as cheaper financing will at most be used to fund existing debt at a lower price. Japan’s “lost decade” recession of the nineties or the global financial crisis in 2008 have been attributed to this type of recession.
In shock-induced recessions, their origination comes from outside of the economic or financial realm. The tripling of the oil price in 1973, following geopolitical events, led to an immediate fall in disposable income, as well as output losses, that crashed most advanced economies into a recession. The COVID-19 shock, on the other hand, pulled the rug from under the service sector (and initially the manufacturing sector too), leading to a synchronous, global demand-side shock.
Recessions from a bird’s eye view
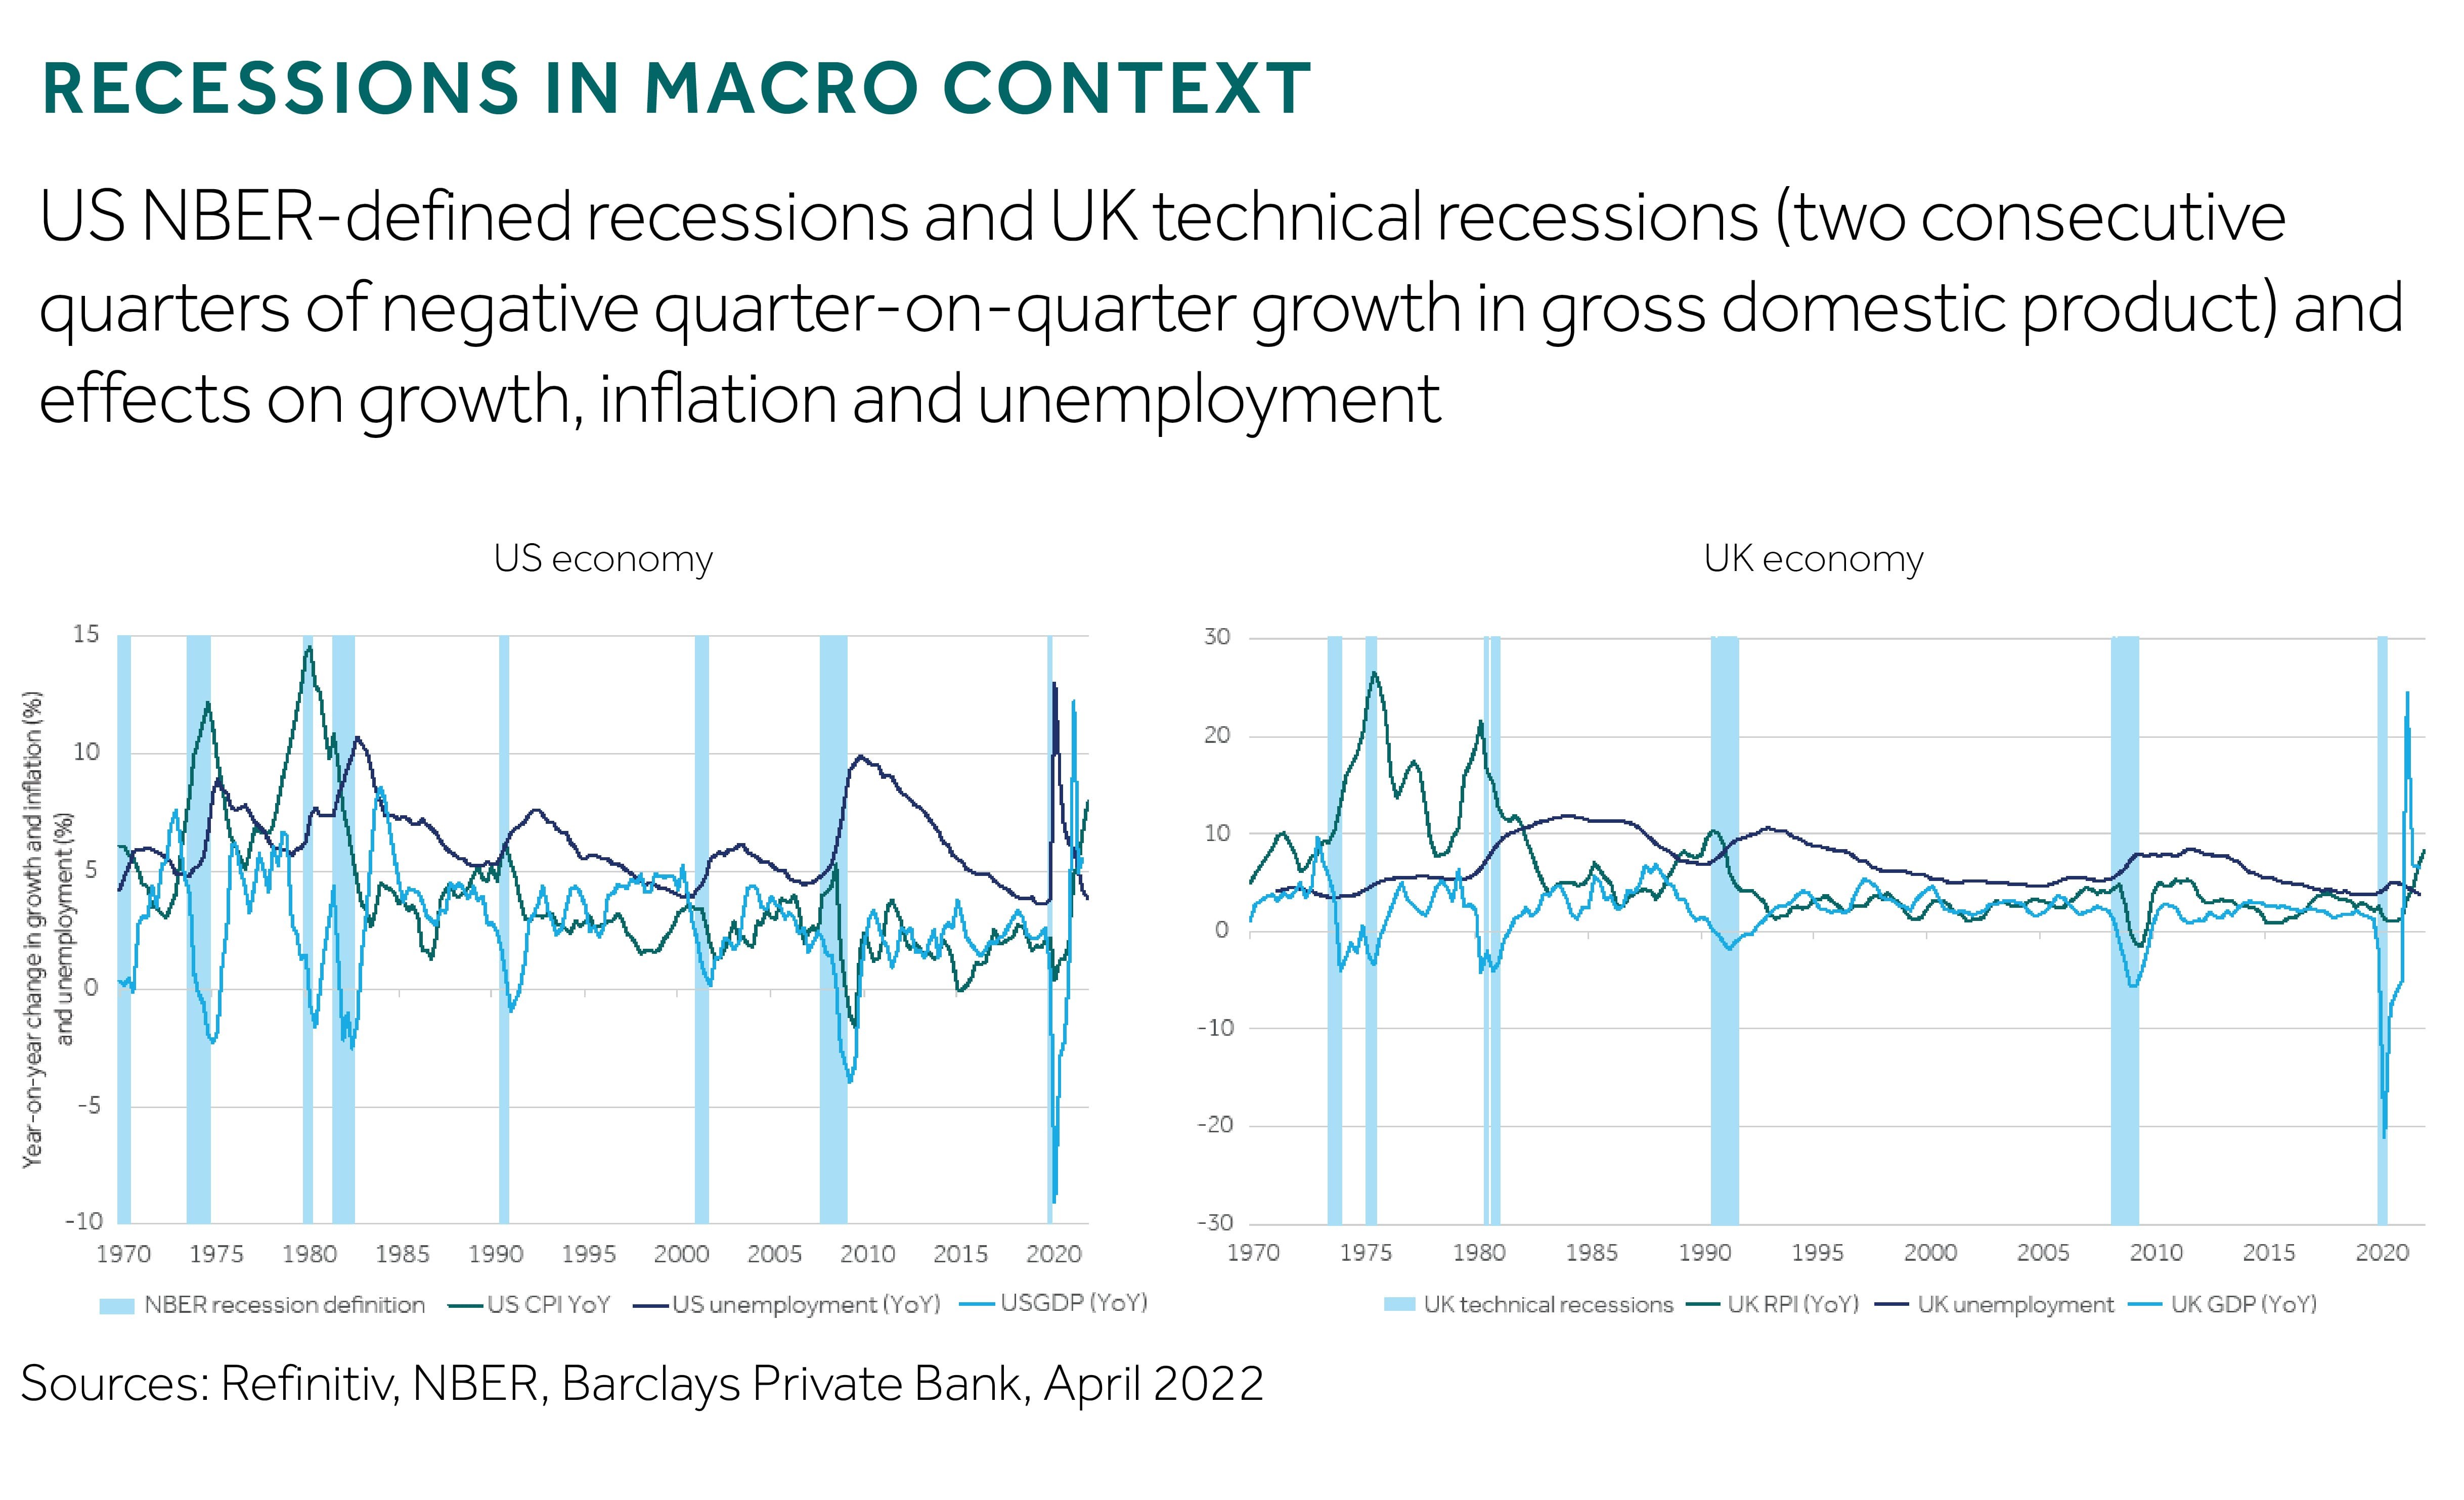
One distinction often made is the behaviour of inflation. The following two charts display inflation, real gross domestic product (GDP) growth, and unemployment rates for the US and UK from 1970. In a typical business cycle recession, like seen by the UK in 1991, inflation is reined in by aggressive monetary policy tightening. If the inflationary hit, however, is outside of the central bank’s control and inflation expectations are not well-anchored, prices can soar throughout the recession, as was the case in the 1970s supply-side shock recessions.
Recessions at the micro level
Analysing recessions from a micro perspective, and looking at GDP from the income perspective, the data are a lot messier. However, one obvious observation in the last five decades is that first company profits suffer, then employee pay declines for most of the contraction and the beginning of the expansion, before profits and finally total wages start to recover again (see chart). This lag in the reaction and subsequent drawn-out recovery of employee compensation are caused by the nominal stickiness of wages.
From this point of view, the coronavirus shock in America was violent, followed by a mini-cycle that looks to have already completed. For Europe and many emerging economies, where the policy response relied more on automatic stabilisers such as unemployment insurance or short-time work, the cycle is not as advanced. This has implications for the risks stemming from a temporary period of extreme inflation. These risks are lower due to the earlier position in the cycle.
How markets performed
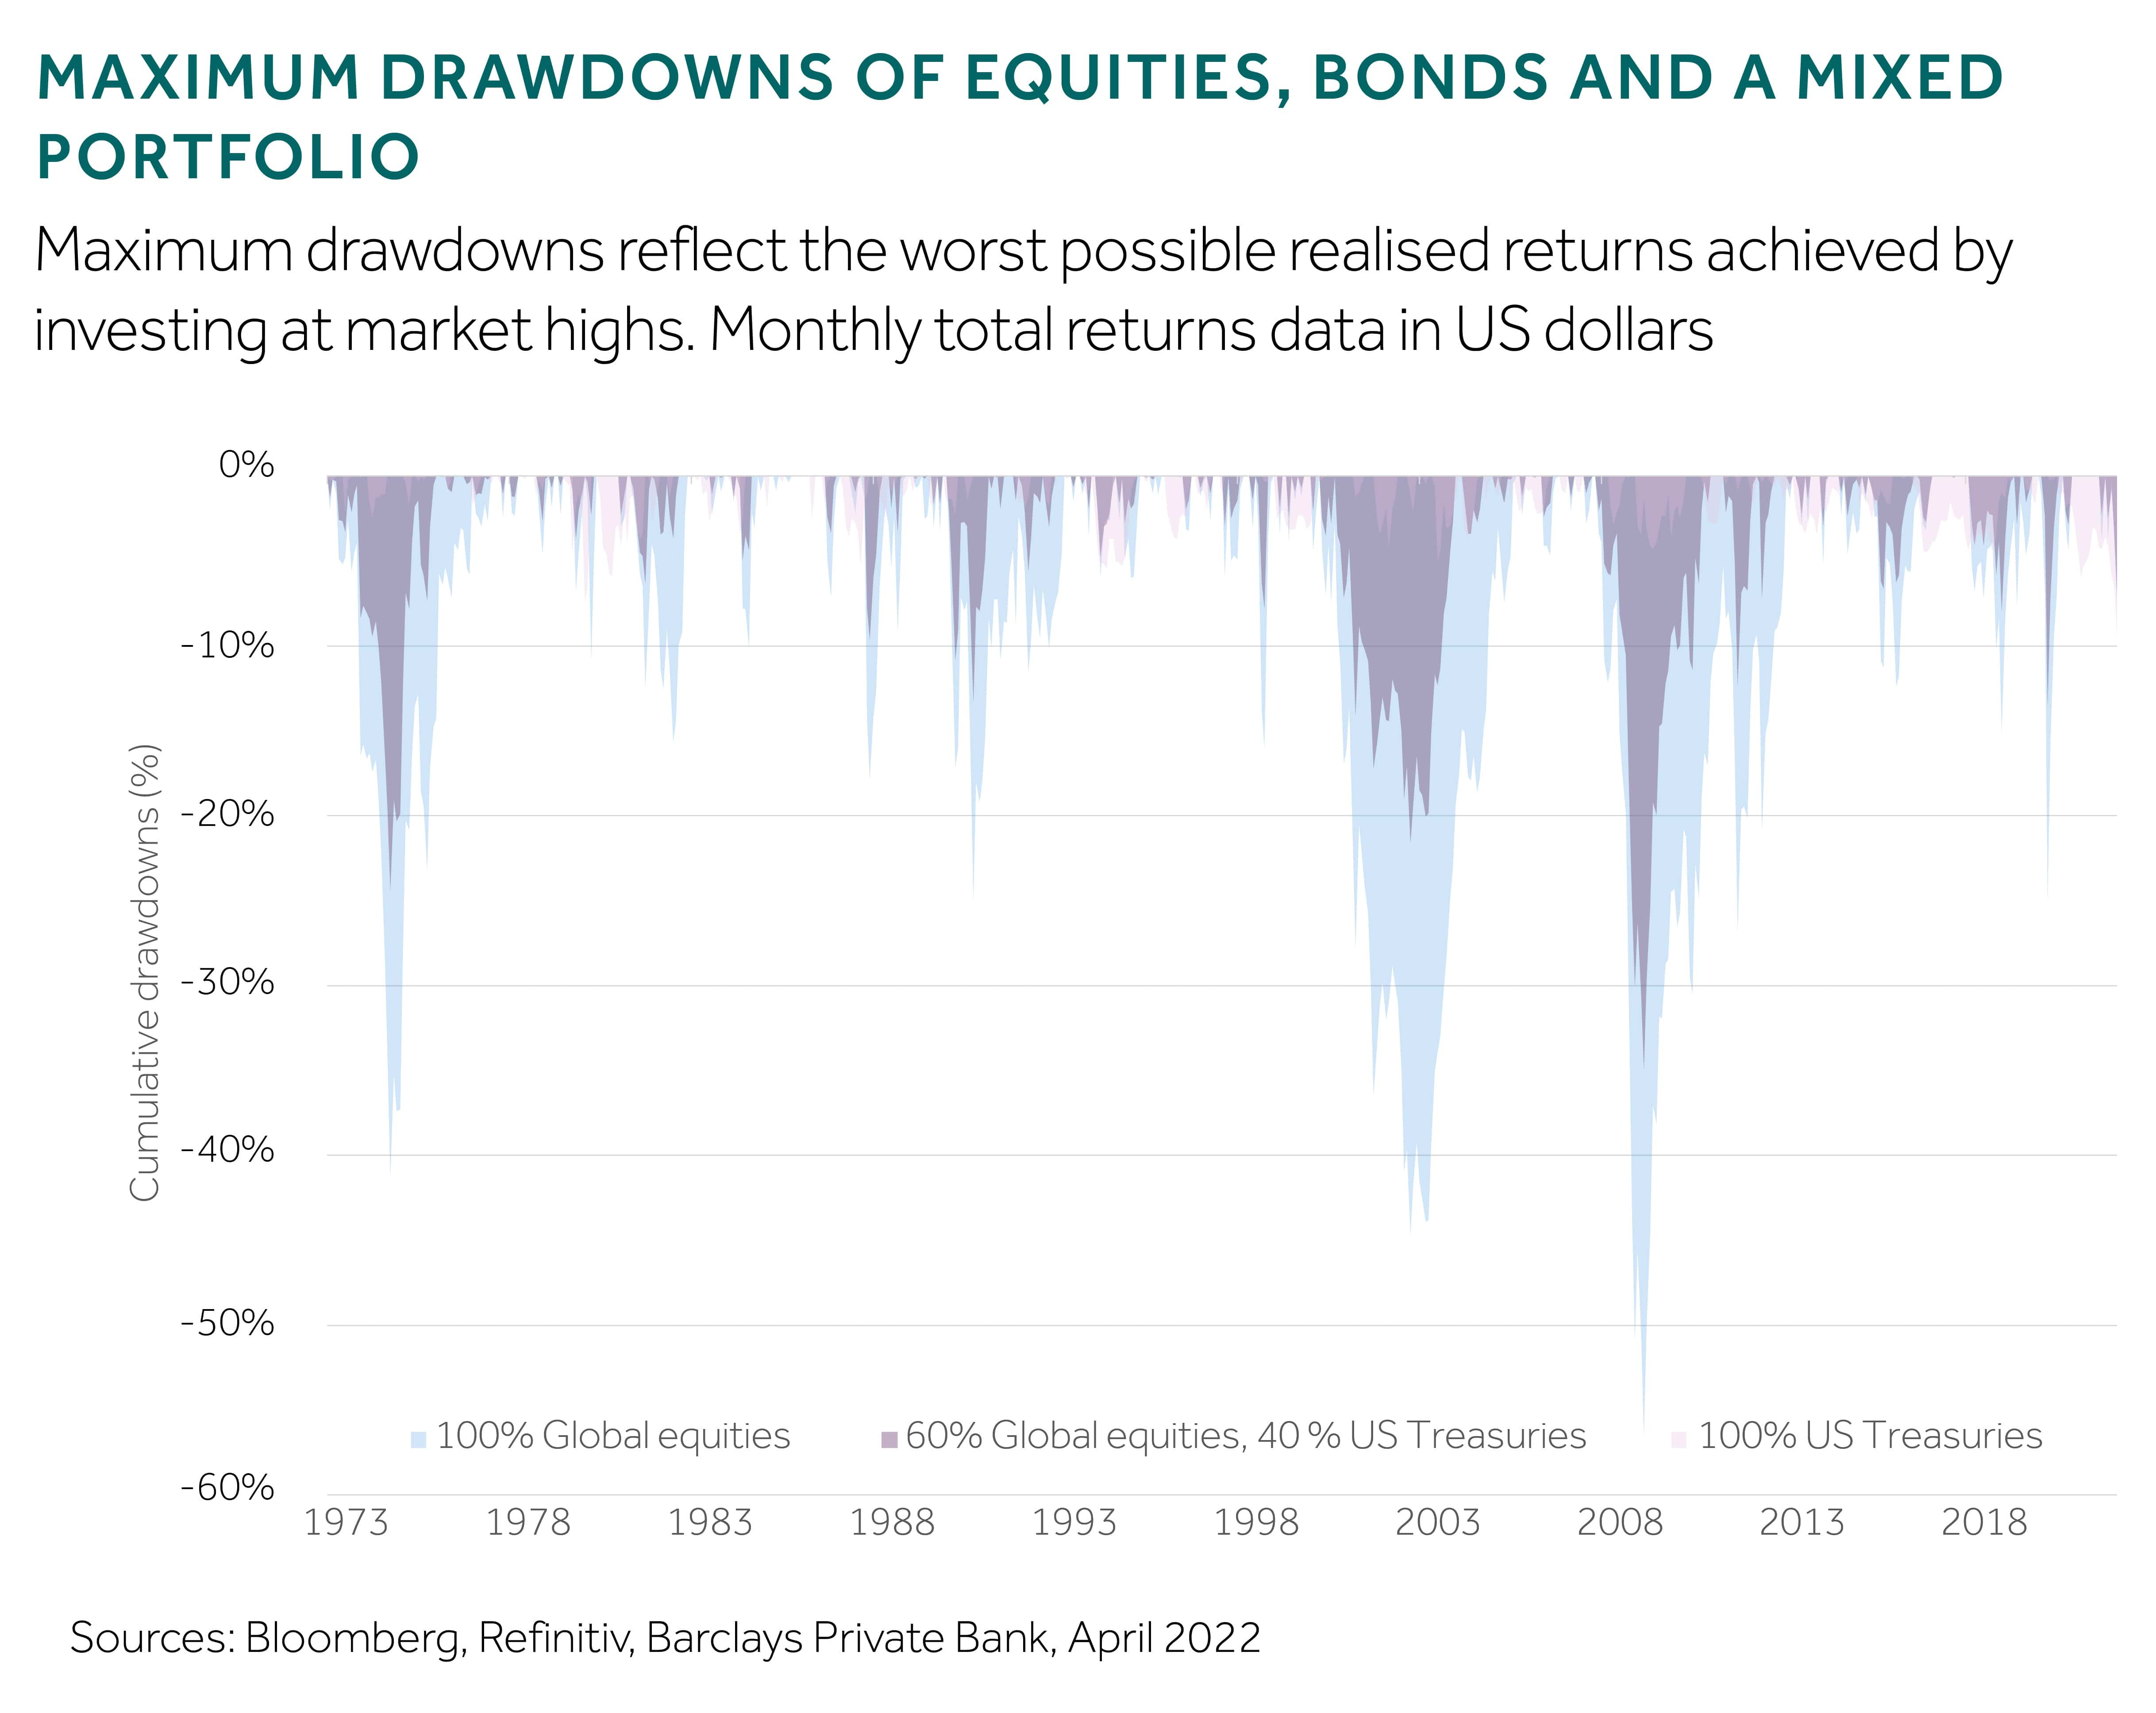
Recessions typically spill over from the real economy to financial markets (or the other way around), and therefore it comes a no surprise that historically they are the worst periods to hold risky assets. For our analysis, we computed cumulative losses since 1973 based on monthly total returns. Starting from a peak we measure cumulative returns to the point when the peak-level is restored.
A pure global equity portfolio sustained its heaviest losses during the global financial crisis (see chart). By mixing in 40% of US government bonds – a very crude diversification strategy – the maximum drawdowns were roughly halved in most recessions. A more sophisticated diversification strategy could provide even more protection, but the data is not sufficiently long enough to allow legitimate comparison across recessions.
From this perspective, the oil shocks seen in 1973 and 1979 were not the most frightening market event for a long-term investor. However, local equity markets had less international exposure then and valuations were much lower than seen more recently.
Current worries: stagflation
Market participants have been increasingly worried about stagflation risk this year. Stagflation describes a period of low growth and high inflation, traditionally seen as strange bedfellows, and was last experienced in the 1970s. The key to assessing whether stagflation is coming or much-desired relief on the inflation is round the corner lies in inflation expectations.
After a worrying surge in long-term inflation expectations last year, survey measures from both consumers and professional forecasters improved in the first quarter, re-strengthening inflation expectation anchors. This reflects the general trust in the ability of central banks to bring inflation back under control eventually.
However, surveys for one-year ahead inflation expectations have climbed again this year. Worryingly, they will be the basis for many wage negotiations this year in a tightening labour market.
Similar increases for short-term inflation expectations were measured for the UK and the eurozone. However, as pointed out earlier, the cycle is less advanced than the US one, which should dampen the inflationary effect of rising short-term expectations.
In equities, the stakes are high
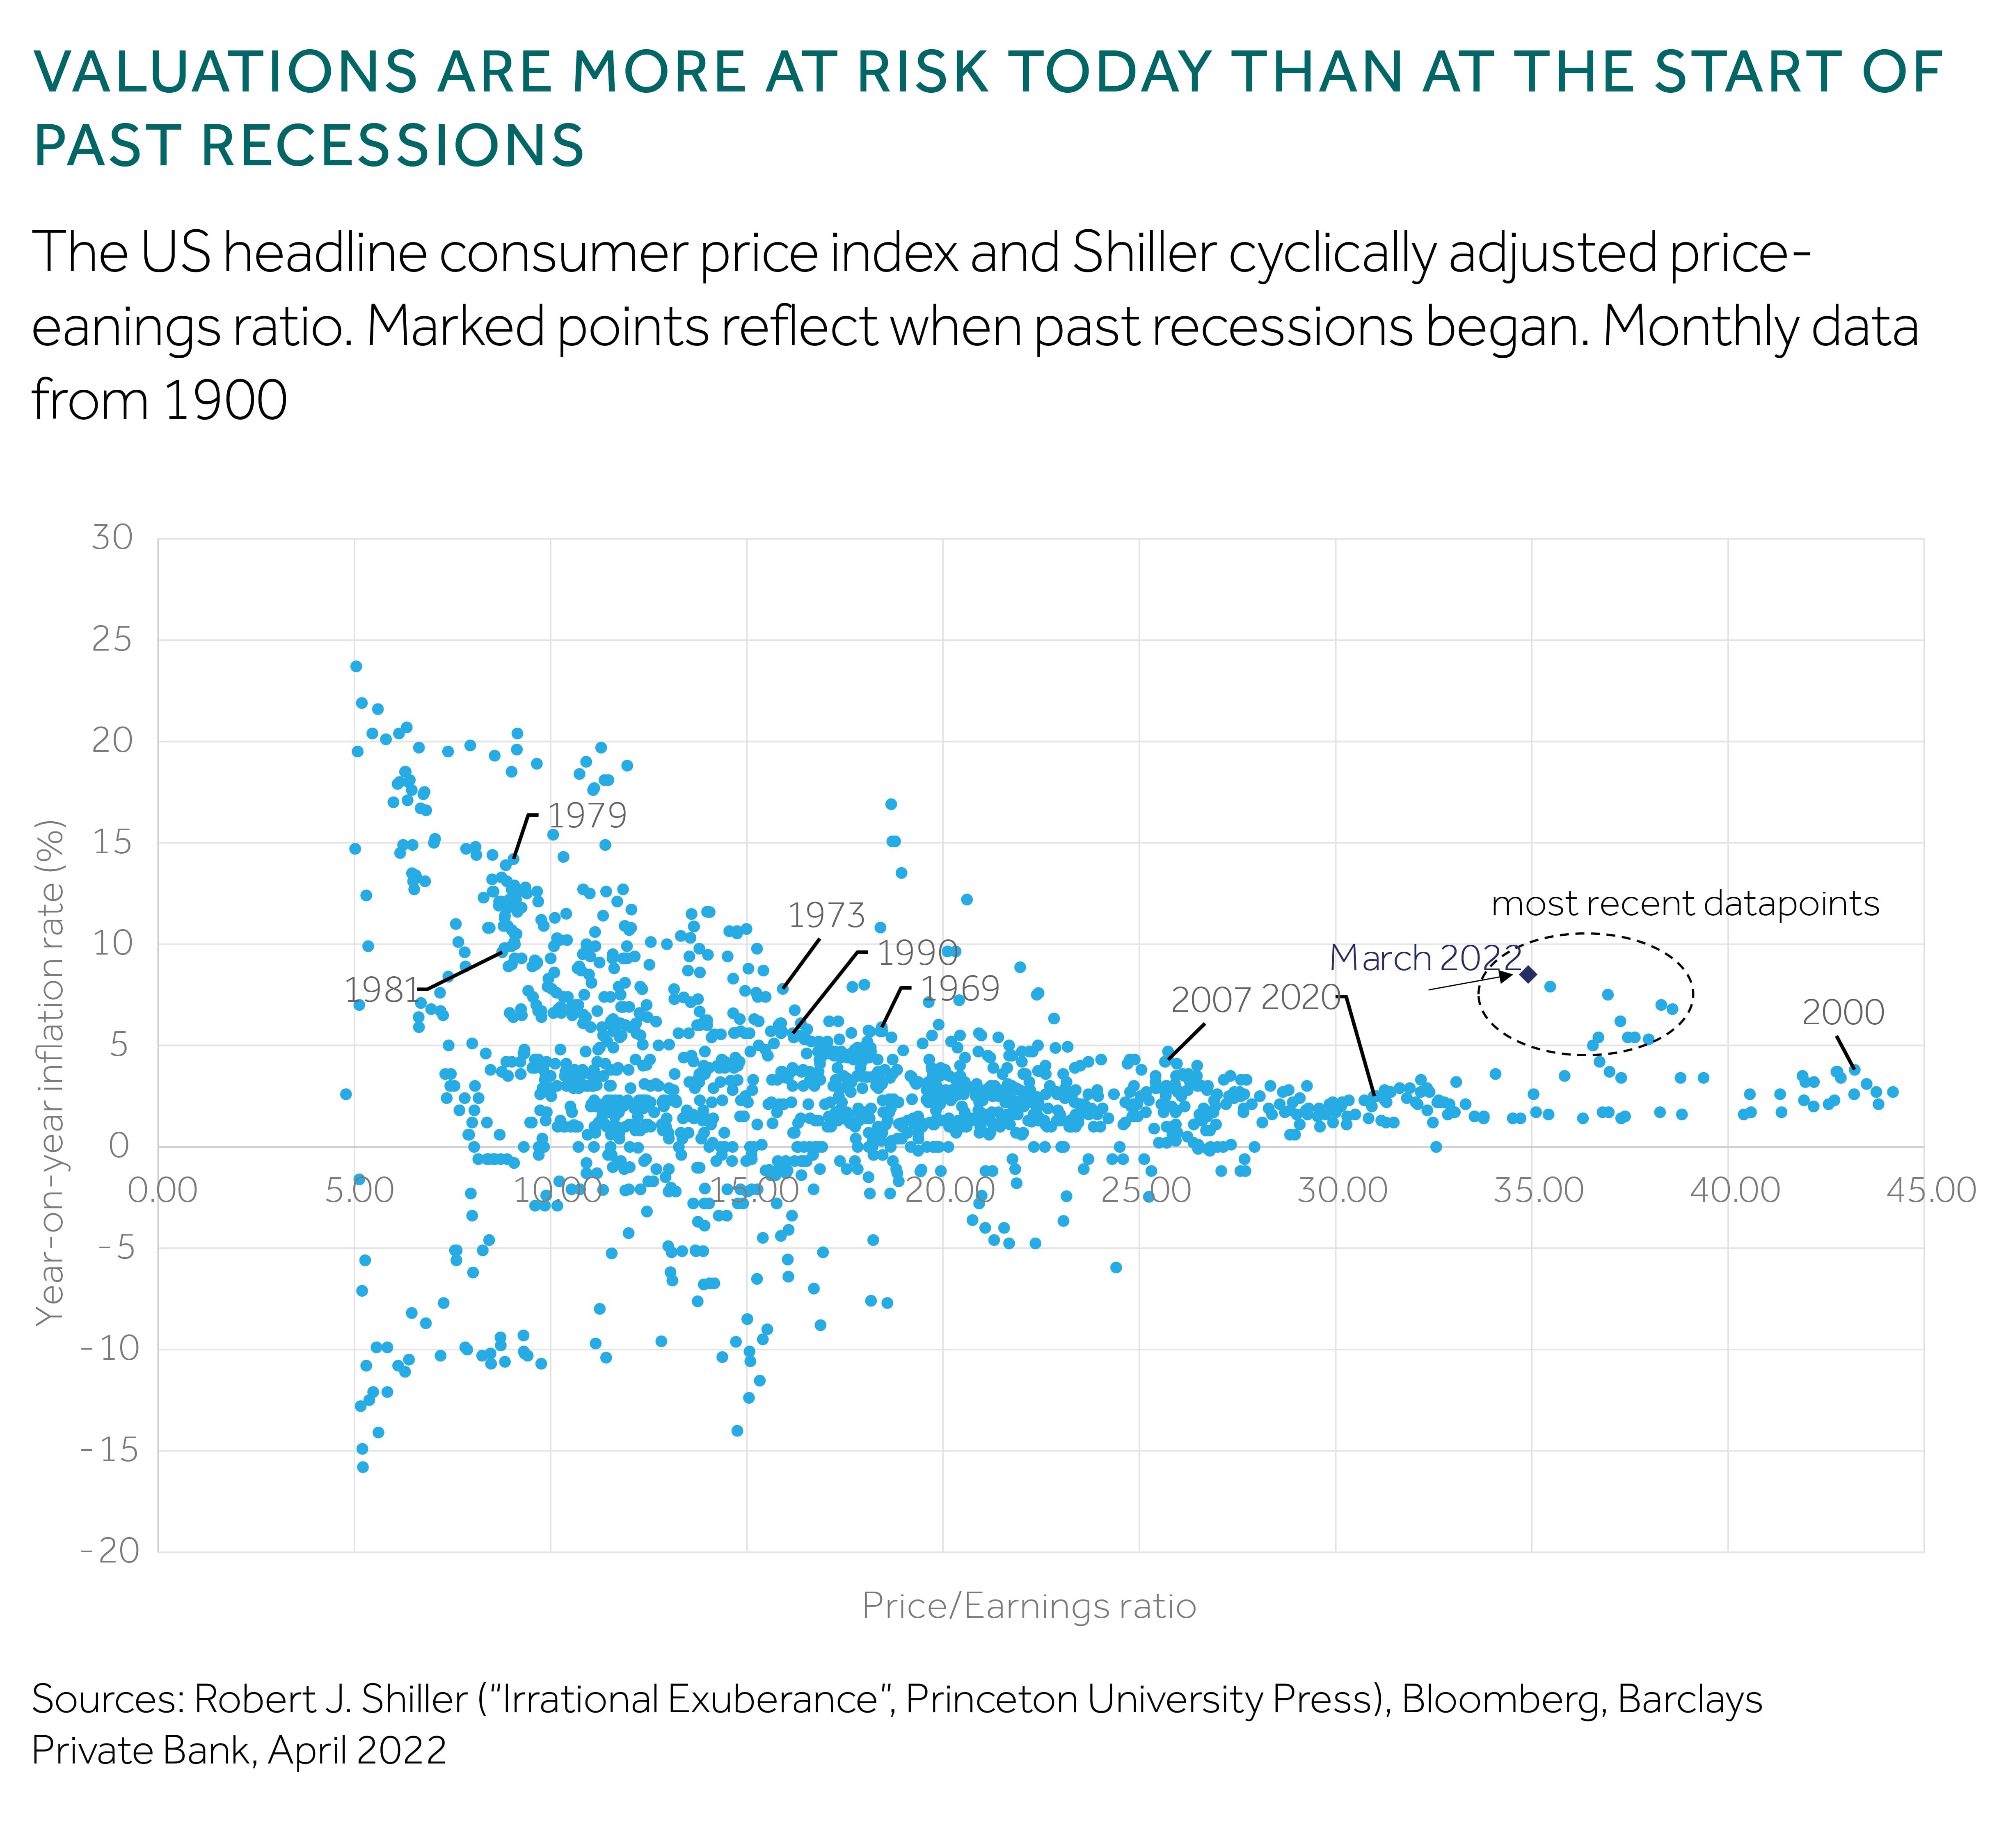
What is clear at the moment is that valuations in equity markets are elevated in absolute terms. Using the approach to estimate cyclically adjusted price-earnings (CAPE) ratios for S&P 500 first described by Professor Shiller in his book Irrational Exuberance, we find valuation multiples of 35 (see chart). Based on the recessions seen in the past 50 years, only the popping of the dotcom bubble started at a higher CAPE ratio.
The next chart, plotting CAPE ratios against headline inflation in the US, again highlights the role of inflation. In the past, Shiller CAPE ratios could even go beyond 40, but never with inflation rates outside of the zero to five percent range – a band in which US Federal Reserve banks typically feel more comfortable with an additional buffer added on top.
The motivation to include inflation in this chart is that high inflation rates tend to encourage timely and strong interest rate hikes that lead to corrections in equity prices. Because the current situation is somewhat unique, as exemplified by the outlier dots in our analysis, historical patterns (such as a significant drop in equity prices) may not repeat themselves, and salvation could come from a timely dip in inflationary pressure. Yet, investors, should be aware of the risks.
Diversification called for
With mounting wage pressures and high stakes in equity valuations in mind, we prefer defensive sectors in equities and repeat the appeal of diversification in portfolios.
Not only have economies become much less dependent on oil since the 1970s, but the trilogy of globalisation, the internationalisation of asset markets, and innovative monetary policy have warped the financial landscape. In turn, making it far more difficult, if possible, to compare the economy now with the past.
What we can say with certainty is that when the next recession hits, a multi-asset diversified portfolio will be better equipped to withstand the brunt of it, and guard wealth.
Recessions at the micro level
Analysing recessions from a micro perspective, and looking at GDP from the income perspective, the data are a lot messier. However, one obvious observation in the last five decades is that first company profits suffer, then employee pay declines for most of the contraction and the beginning of the expansion, before profits and finally total wages start to recover again (see chart). This lag in the reaction and subsequent drawn-out recovery of employee compensation are caused by the nominal stickiness of wages.
From this point of view, the coronavirus shock in America was violent, followed by a mini-cycle that looks to have already completed. For Europe and many emerging economies, where the policy response relied more on automatic stabilisers such as unemployment insurance or short-time work, the cycle is not as advanced. This has implications for the risks stemming from a temporary period of extreme inflation. These risks are lower due to the earlier position in the cycle.


