-
""

Equities

Can equities outperform when the Federal Reserve raises interest rates?

07 February 2022

By Dorothée Deck, London UK, Cross Asset Strategist

With the US Federal Reserve on the cusp of launching a rate-hiking cycle, the potential impact of tighter policy on your portfolio is key. We look at how equities have performed in previous cycles, and what this might mean for portfolio.

You’ll find a short briefing below. To read the full article, please select the ‘full article’ tab.

  • Summary
    • So far this year, we’ve seen some sharp price moves and violent rotations within equities – with investors expecting the US Federal Reserve to tighten monetary policy at a much faster pace to tame inflation
    • But as history shows, when the Fed prepares for a rate-hiking cycle, equities have performed well in the run up to, and during, such cycles in the last 30 years
    • And with fears of a sudden market sell-off, we dig deeper to find out how equities have typically performed in previous hiking cycles – and what this implies for equity exposure and portfolio positioning
    • In summary, while we anticipate that equity markets will remain volatile in the coming months, we do not see the next era of rising rates to be materially different from the past – especially as aggressive tightening by the Fed is already priced in
  • Full article

    This year has already seen some sharp price moves and violent rotations in equities. The rotations were triggered by a large rise in yields, following more hawkish signs from the US Federal Reserve (Fed) and other central banks, in response to persistent inflationary pressures and tight labour markets.

    Investors, and central bankers, were further reassured by growing signs that the Omicron variant appears to be less virulent than previous strains of the virus, and less of a threat for economies.

    Jump in Treasury yields and inflation spooks investors

    US 10-year yields hit 1.87% in mid-January, from 1.33% in early December, and were close to their pre-pandemic level. The market is now pricing in five rate hikes in the next 12 months, starting in March. Bond yields in other areas, including Germany, have also repriced sharply higher. As a result, long-duration assets have been hit hard, catching many by surprise. In equities, there was a powerful rotation to value from growth, and to cyclicals from defensives.

    Until we see inflation convincingly peaking, we believe those rotations have more legs, this favours a pro-cyclical stance in portfolios, as well as a value tilt, reiterating the views expressed in our Outlook 2022.

    Historically, the main beneficiaries of higher yields and inflation have been financials, energy, industrials, and basic materials. We believe that those sectors remain well positioned in the near term. They are more heavily concentrated in value indices and non-US markets.

    In contrast, the sectors that tend to be most negatively correlated with yields and inflation include telecoms, healthcare, utilities, consumer staples, and technology. Despite recent underperformance, we believe that group of companies will remain vulnerable in the near term, as these sectors are more defensive, have longer duration assets, and are more heavily concentrated in growth indices and the US market.

    Concerns about over-aggressive policy tightening

    One of the main concerns at present is the risk that excessive policy tightening could derail growth, and lead to a market sell-off, or even a bear market. Our view is that a lot of the repricing has already been done on the fixed income side, and that inflation should decline progressively in the second half of the year, as supply constraints ease, and demand shifts to services from manufactured goods.

    While the path of policy normalisation currently priced in by the market is faster and more aggressive than we initially anticipated, yields seem unlikely to reach a level that will hurt the economy, or derail markets. Yields remain low by historical standards, and certainly well below the above-trend growth that we expect globally in the next couple of years.

    In addition, the equities’ earnings yield still significantly exceeds bond yields, supporting the continued outperformance of stocks versus bonds, and encouraging the “There is no alternative” (Tina) mindset to prevail. Finally, the macro backdrop remains favourable, with global activity supported by large excess savings, accommodative financial conditions, an expected pickup in capital expenditure, and restocking.

    Fed hiking cycles - a history

    In order to address investors’ concerns that the upcoming hiking cycle could present a major risk for stocks, we look at how equity markets have performed in the four previous hiking cycles, stretching back to 1994.

    While there have been nine hiking cycles from the US Federal Reserve (Fed) since the 1970s, our analysis focuses on the last four (February 1994, June 1999, June 2004, and December 2015). Markets were very different back in the 1970s and 1980s, and as a result, offer less useful comparisons for investors today.

    The hiking cycles were much steeper, to combat very high inflation, and the Fed did not communicate explicitly on its policy targets. In the last four hiking cycles, the central bank raised policy rates by only 188 basis points, on average, in the first 12 months, from 2.25% to 4.13%.

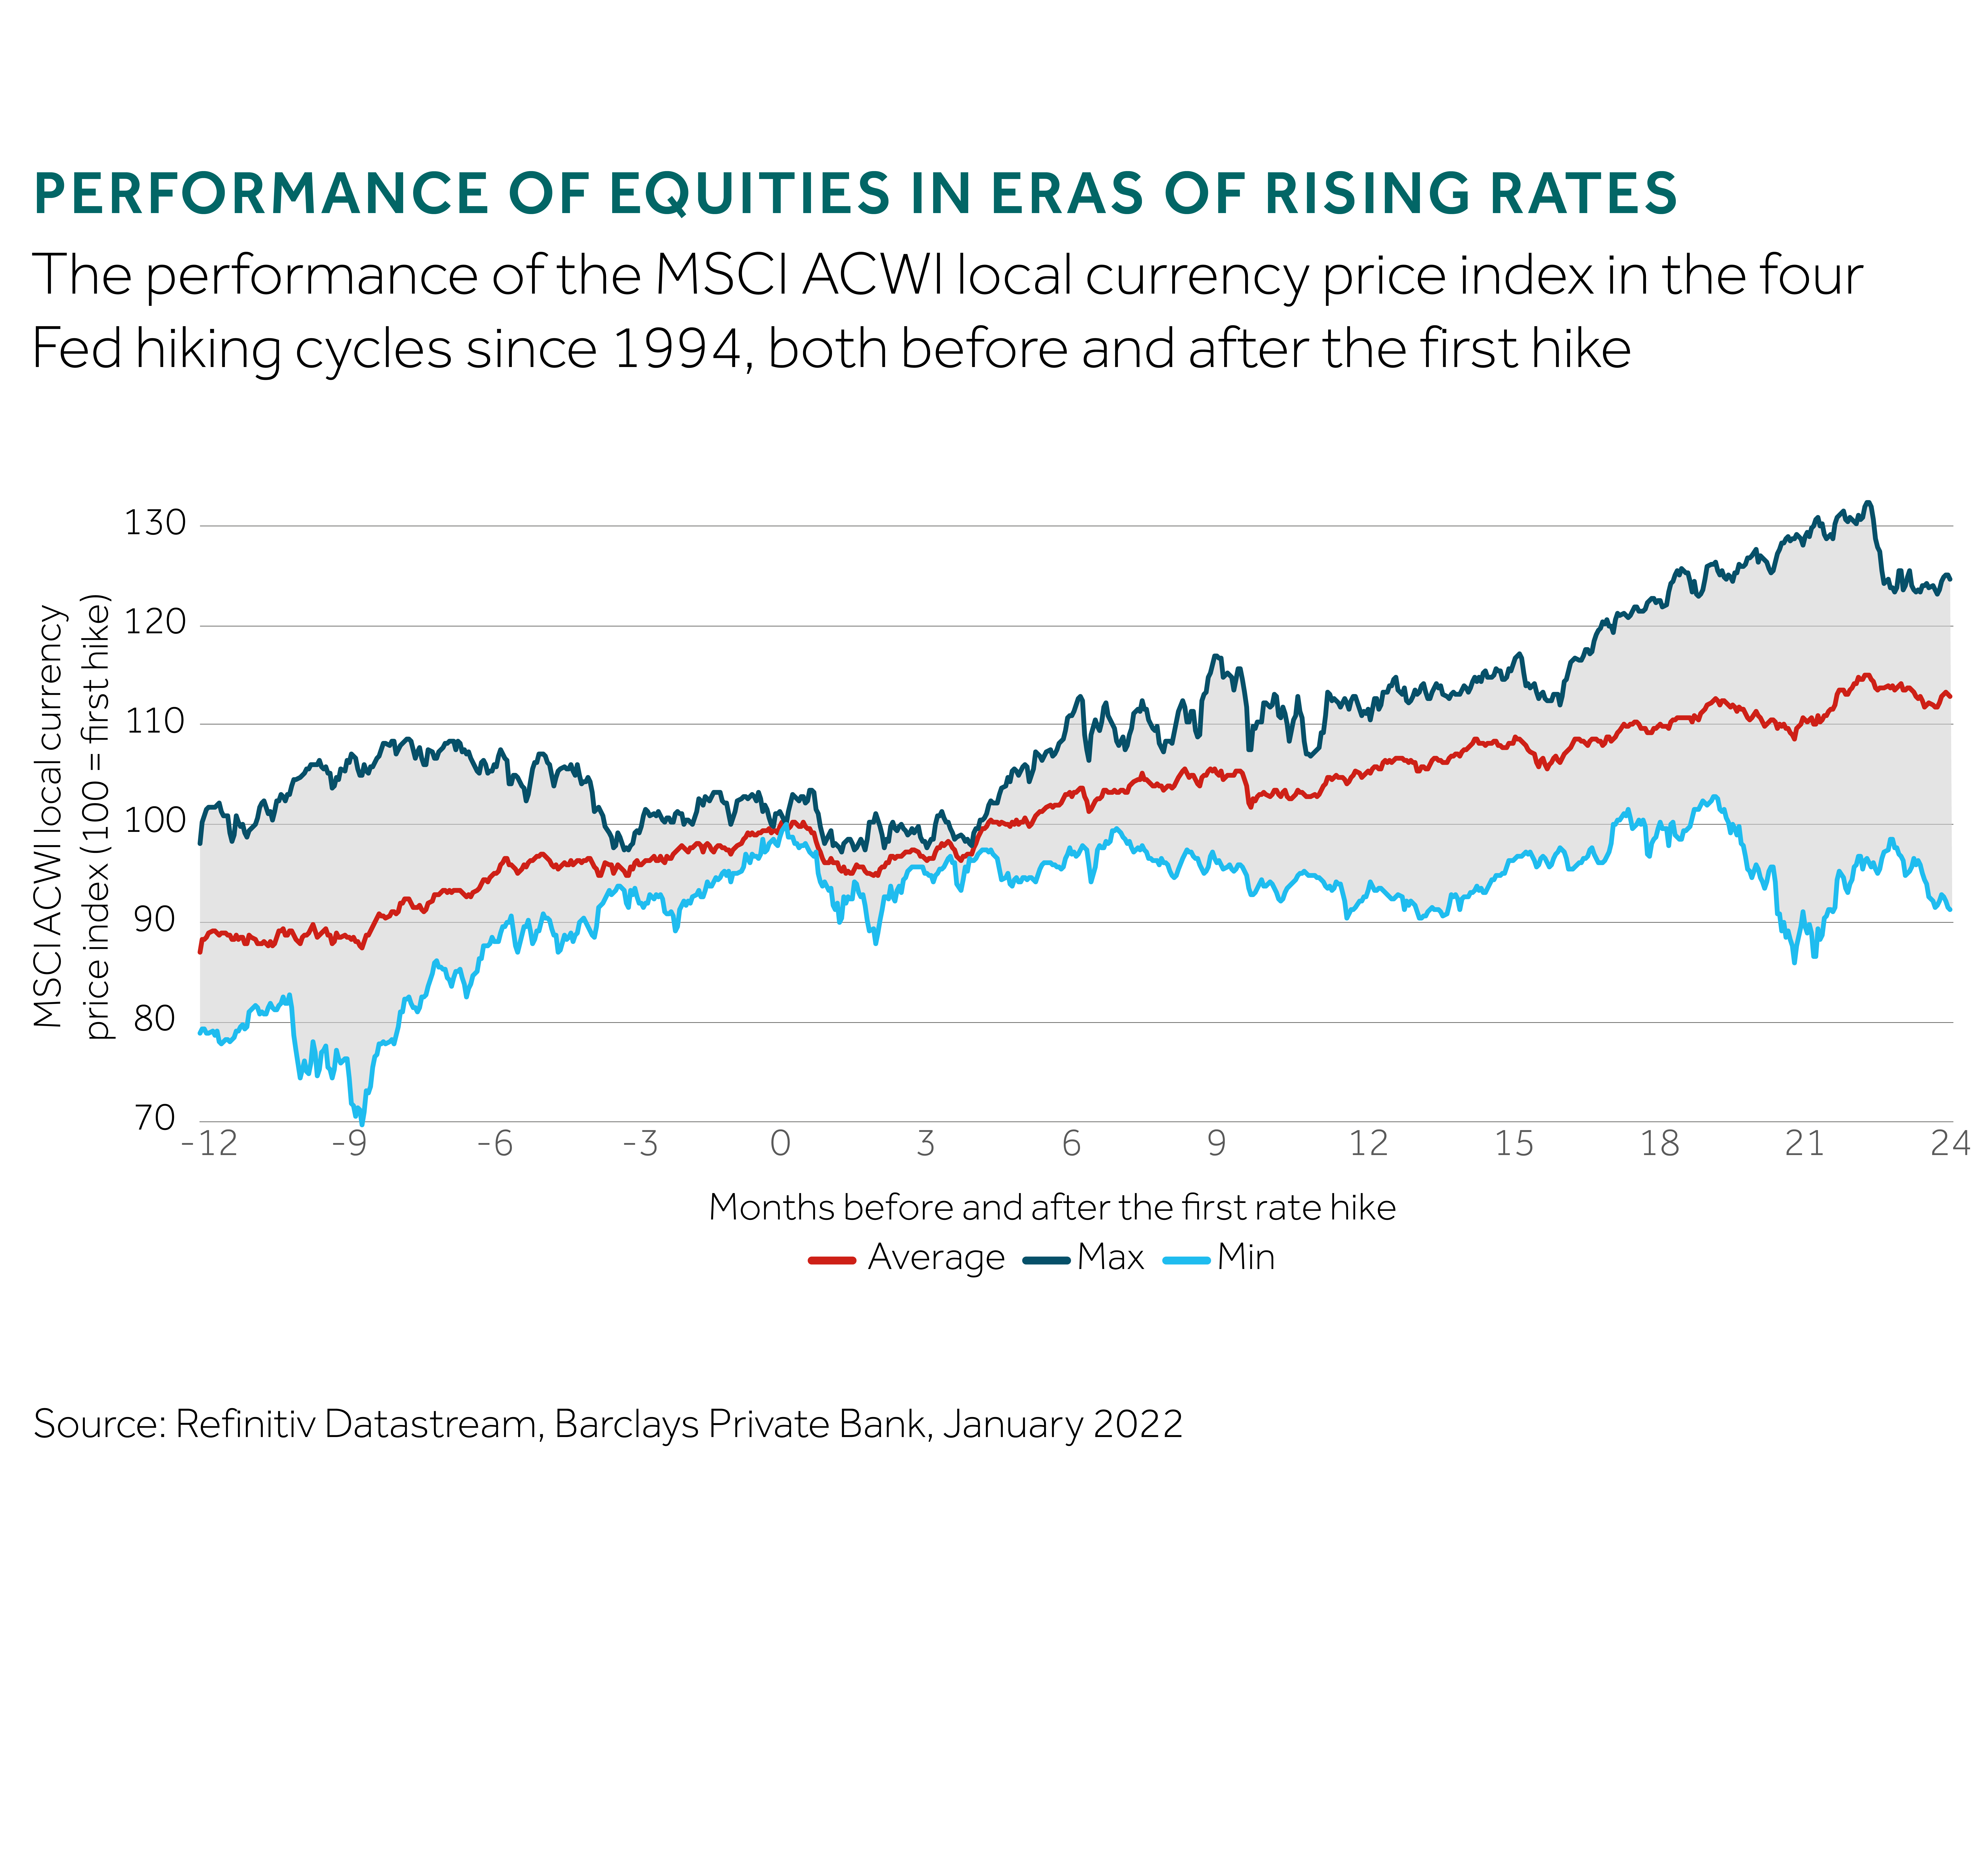
    Equities tend to perform well around hiking cycles

    Equity markets generally performed well in the months before the first hike, in the US and globally (see chart). They typically saw a mild, short-lived sell-off in the first couple of months following the initial rate hike, but they generally shrugged off the news quickly, and resumed their up-trend as the Fed continued to tighten.

    Based on local currency MSCI ACWI indices, both US and non-US equities saw a 5% average drawdown in the first two months. However, by the third month, both indices had resumed their up-trend and recovered all their losses within five months of the cycle commencing. Twelve months after the first hike, US and global equities were up 6% and 5% respectively. They were up 16% and 13% respectively, two years after the first hike. The worst drawdown was seen after the December 2015 hike, when global equities lost 12% in the first couple of months.

    As always, those numbers should be treated with caution. How equity market react to a hiking cycle depends on many factors, including how well the policy moves were flagged, to what extent they were already priced in, and obviously the level of rates, and the speed and magnitude of policy normalisation.

    Regional and sector returns during hiking cycles

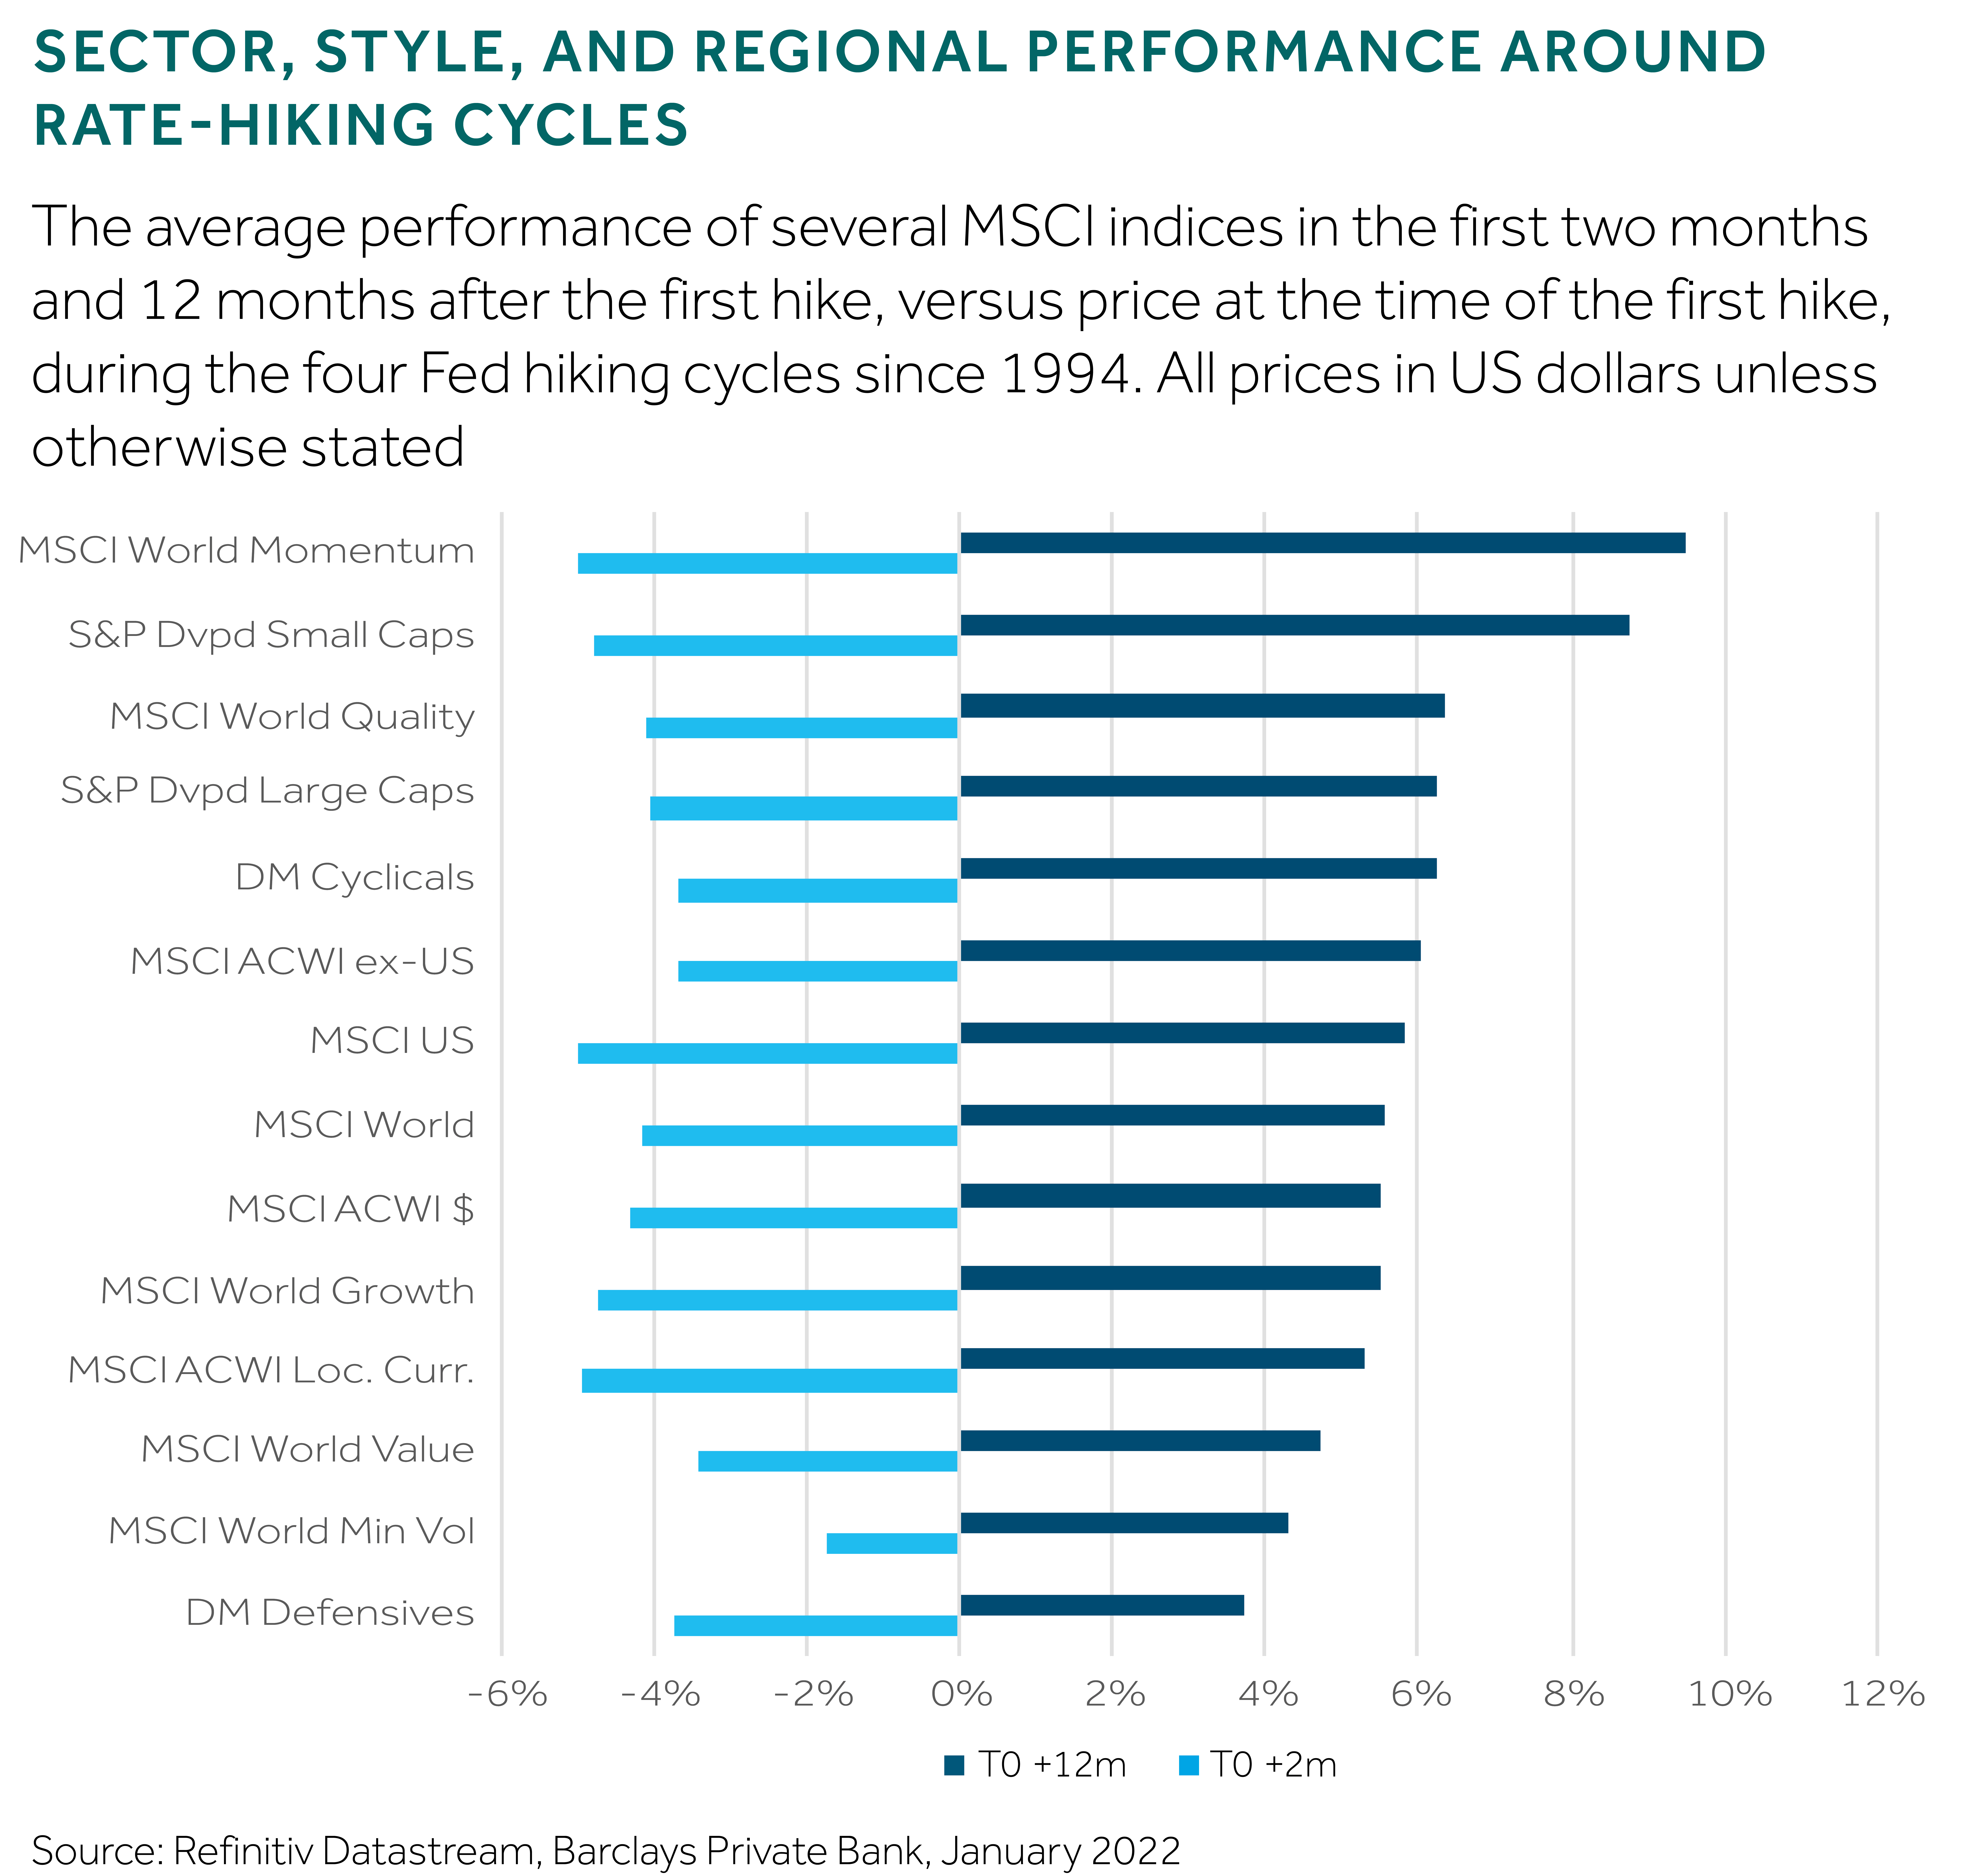
    Relative performance within the equity market during rate-hiking periods also provides some interesting readings (see chart). Non-US equities outperformed the US by 8%, on average, in common currency terms in the first eight months following the Fed’s first hike, helped by a weaker USD. Afterwards, relative performance tended to converge, to finish in line after twelve months.

    Similarly, developed markets small-cap equities outperformed large caps by 4%, on average, in the first eight months of the cycle. The MSCI World Value and Growth indices performed essentially in line with each other, as was the case for cyclicals versus defensives.

    *Cyclical and defensive indices mentioned in this note refer to Barclays Private Bank’s market-cap weighted indices denominated in USD; cyclicals include financials, consumer discretionary, industrials, energy, basic materials, technology hardware; defensives include healthcare, consumer staples, telecoms, utilities, real estate, and software and computer services.

    Sector, style, and regional performance around rate-hiking cycles

    The average performance of several MSCI indices in the first two months and 12 months after the first hike, versus price at the time of the first hike, during the four Fed hiking cycles since 1994. All prices in US dollars unless otherwise stated

    For all the styles covered, the biggest drawdowns were seen in the first couple of months, varying between -5% for momentum, small caps, and growth, and -2% for minimum volatility, based on monthly readings. By the third month, all indices had resumed their up-trend. Twelve months after the first hike, the best performing indices were momentum and small caps, up 9%, while the main laggards were defensives and minimum volatility, up 4%.

    A time to be diversified and nimble

    Equities have usually performed relatively well in the run up to and during US rate-hiking cycles in the past thirty years. After an initial blip, equities delivered mid-single digit returns in the year following the start of the hiking cycle. We do not expect this cycle to be any different, especially as aggressive tightening by the Fed is already priced in. That being said, we continue to expect increased volatility in the coming months, requiring investors to be diversified and nimble.

Related articles

""

Market Perspectives March 2022

Welcome to the March edition of "Market Perspectives", the monthly investment strategy update from Barclays Private Bank. In this month’s report, we look at just how likely a recession might be, and what it could mean for equities, bonds, and other asset classes.

Disclaimer

This communication is general in nature and provided for information/educational purposes only. It does not take into account any specific investment objectives, the financial situation or particular needs of any particular person. It not intended for distribution, publication, or use in any jurisdiction where such distribution, publication, or use would be unlawful, nor is it aimed at any person or entity to whom it would be unlawful for them to access.

This communication has been prepared by Barclays Private Bank (Barclays) and references to Barclays includes any entity within the Barclays group of companies.

This communication: 

(i) is not research nor a product of the Barclays Research department. Any views expressed in these materials may differ from those of the Barclays Research department. All opinions and estimates are given as of the date of the materials and are subject to change. Barclays is not obliged to inform recipients of these materials of any change to such opinions or estimates;

(ii) is not an offer, an invitation or a recommendation to enter into any product or service and does not constitute a solicitation to buy or sell securities, investment advice or a personal recommendation; 

(iii) is confidential and no part may be reproduced, distributed or transmitted without the prior written permission of Barclays; and

(iv) has not been reviewed or approved by any regulatory authority.

Any past or simulated past performance including back-testing, modelling or scenario analysis, or future projections contained in this communication is no indication as to future performance. No representation is made as to the accuracy of the assumptions made in this communication, or completeness of, any modelling, scenario analysis or back-testing. The value of any investment may also fluctuate as a result of market changes.

Where information in this communication has been obtained from third party sources, we believe those sources to be reliable but we do not guarantee the information’s accuracy and you should note that it may be incomplete or condensed.

Neither Barclays nor any of its directors, officers, employees, representatives or agents, accepts any liability whatsoever for any direct, indirect or consequential losses (in contract, tort or otherwise) arising from the use of this communication or its contents or reliance on the information contained herein, except to the extent this would be prohibited by law or regulation.